The Australian Workplace Equality Index National Engagement Survey 2021: Resources Industry Observations
Written by Christopher Nelson, Senior Relationship Manager, Pride in Diversity | 7 December 2021
Response rate and respondents
There were 4,620 responses from the Resources industry or about 10% of the total 2021 responses.
47% of responses came from employees based in WA with the next highest in Queensland (21%). Most responses came from metropolitan areas (65%) and of those most were full-time employees (87%).
Most respondents were team members (42%) which is slightly higher than for all respondents. Expectedly, women made up 43% of Resources industry respondents as opposed to 54% for all respondents. There was little difference in rates of non-binary genders.
GLBTQ inclusivity within the Resources industry
The Resources responses gave a strong 81% agreement in supporting the work that their employer puts into LGBTQ inclusion, which is lower than the 85% recorded for all respondents. There was a similar difference in support recorded for thinking that this was an important space in which to be active.
In the Resources industry, 83% agree or strongly agree that there are visible signs of support for LGBTQ inclusion whereas only 78% of all respondents agree or strongly agree that there are visible signs of support.
Resources industry employees indicate that they understand some of the unique challenges that LGBTQ employees face in the workplace (81%) whereas 84% of all respondents are aware of these challenges.
The witnessing of negative behaviours is higher from Resources industry respondents at 18% compared to all respondents at 14%. Witnessing more serious bullying of LGBTQ employees is slightly higher in Resources industry at 7% vs 5% for all.
Allies for LGBTQ employees
There are fewer respondents in the Resources industry who identify as active allies for LGBTQ employees in the workplace (17%) as opposed to 20% for all respondents.
Active allies are slightly better known in the Resources industry (59%) compared to 56% overall, as were executive allies at 58% in Resources and only 54% across the board.
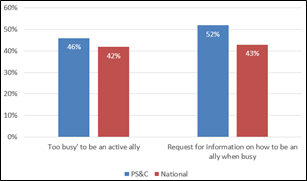
The highest reason for not being an ally in Resources and in all responses was that people were too busy (42% for both) although 25% of all respondents had no personal interest in LGBTQ inclusion, whereas this was higher in the Resources industry at 28%.
36% of Resources industry respondents would be influenced by a better understanding of how to be an active ally which is lower than respondents overall at 40%. 35% of Resources industry respondents said nothing would influence them to become an active ally; slightly higher than all respondents at 32%.
GLBTQ respondents
The Resources sindustry respondents were somewhat lower in their identification as LGBTQ at 15% as opposed to 19%.
A similar percentage of Resources respondents identify as gay or lesbian (53% vs 55%) as for all respondents, although 27% of Resources respondents identified as bisexual as opposed to 24% for all respondents.
On being out about sexual orientation in the workplace, Resources industry respondents are considerably less comfortable being out to all, at 33% compared to 41% for all respondents. Being out to a select few is higher with Resources respondents at 27% vs 21% for all respondents. Likewise, those not out at all is higher with Resources respondents (19%) compared to all respondents (16%).
24% of Resources industry respondents say that they have encountered exclusion based on their sexuality compared to 17% for all respondents, and over 20% of Resources respondents have been the target of unwanted jokes, innuendo, commentary as a direct result of their sexuality. This is considerably higher than the 13% reported by all respondents.
For those respondents not out at work, 40% say that they feel that being out would be detrimental to their workplace experience compared to 33% for all respondents.
Conclusions
The data from the participants in the resources industry is at the highest variance with respondents across all industry when it comes to being out at work or for having experienced actual exclusion, or derisive language in the workplace.
We certainly would need to contextualise the participation rates of survey respondents, as the relatively high number of respondents from metropolitan areas may be at odds with all employees typically assumed to be “resources workers”. Subject to validating the participation rates of those outside metropolitan areas, increasing participation in future surveys by those who are in regional areas or perhaps FIFO staff may help build a more comprehensive picture for this industry.
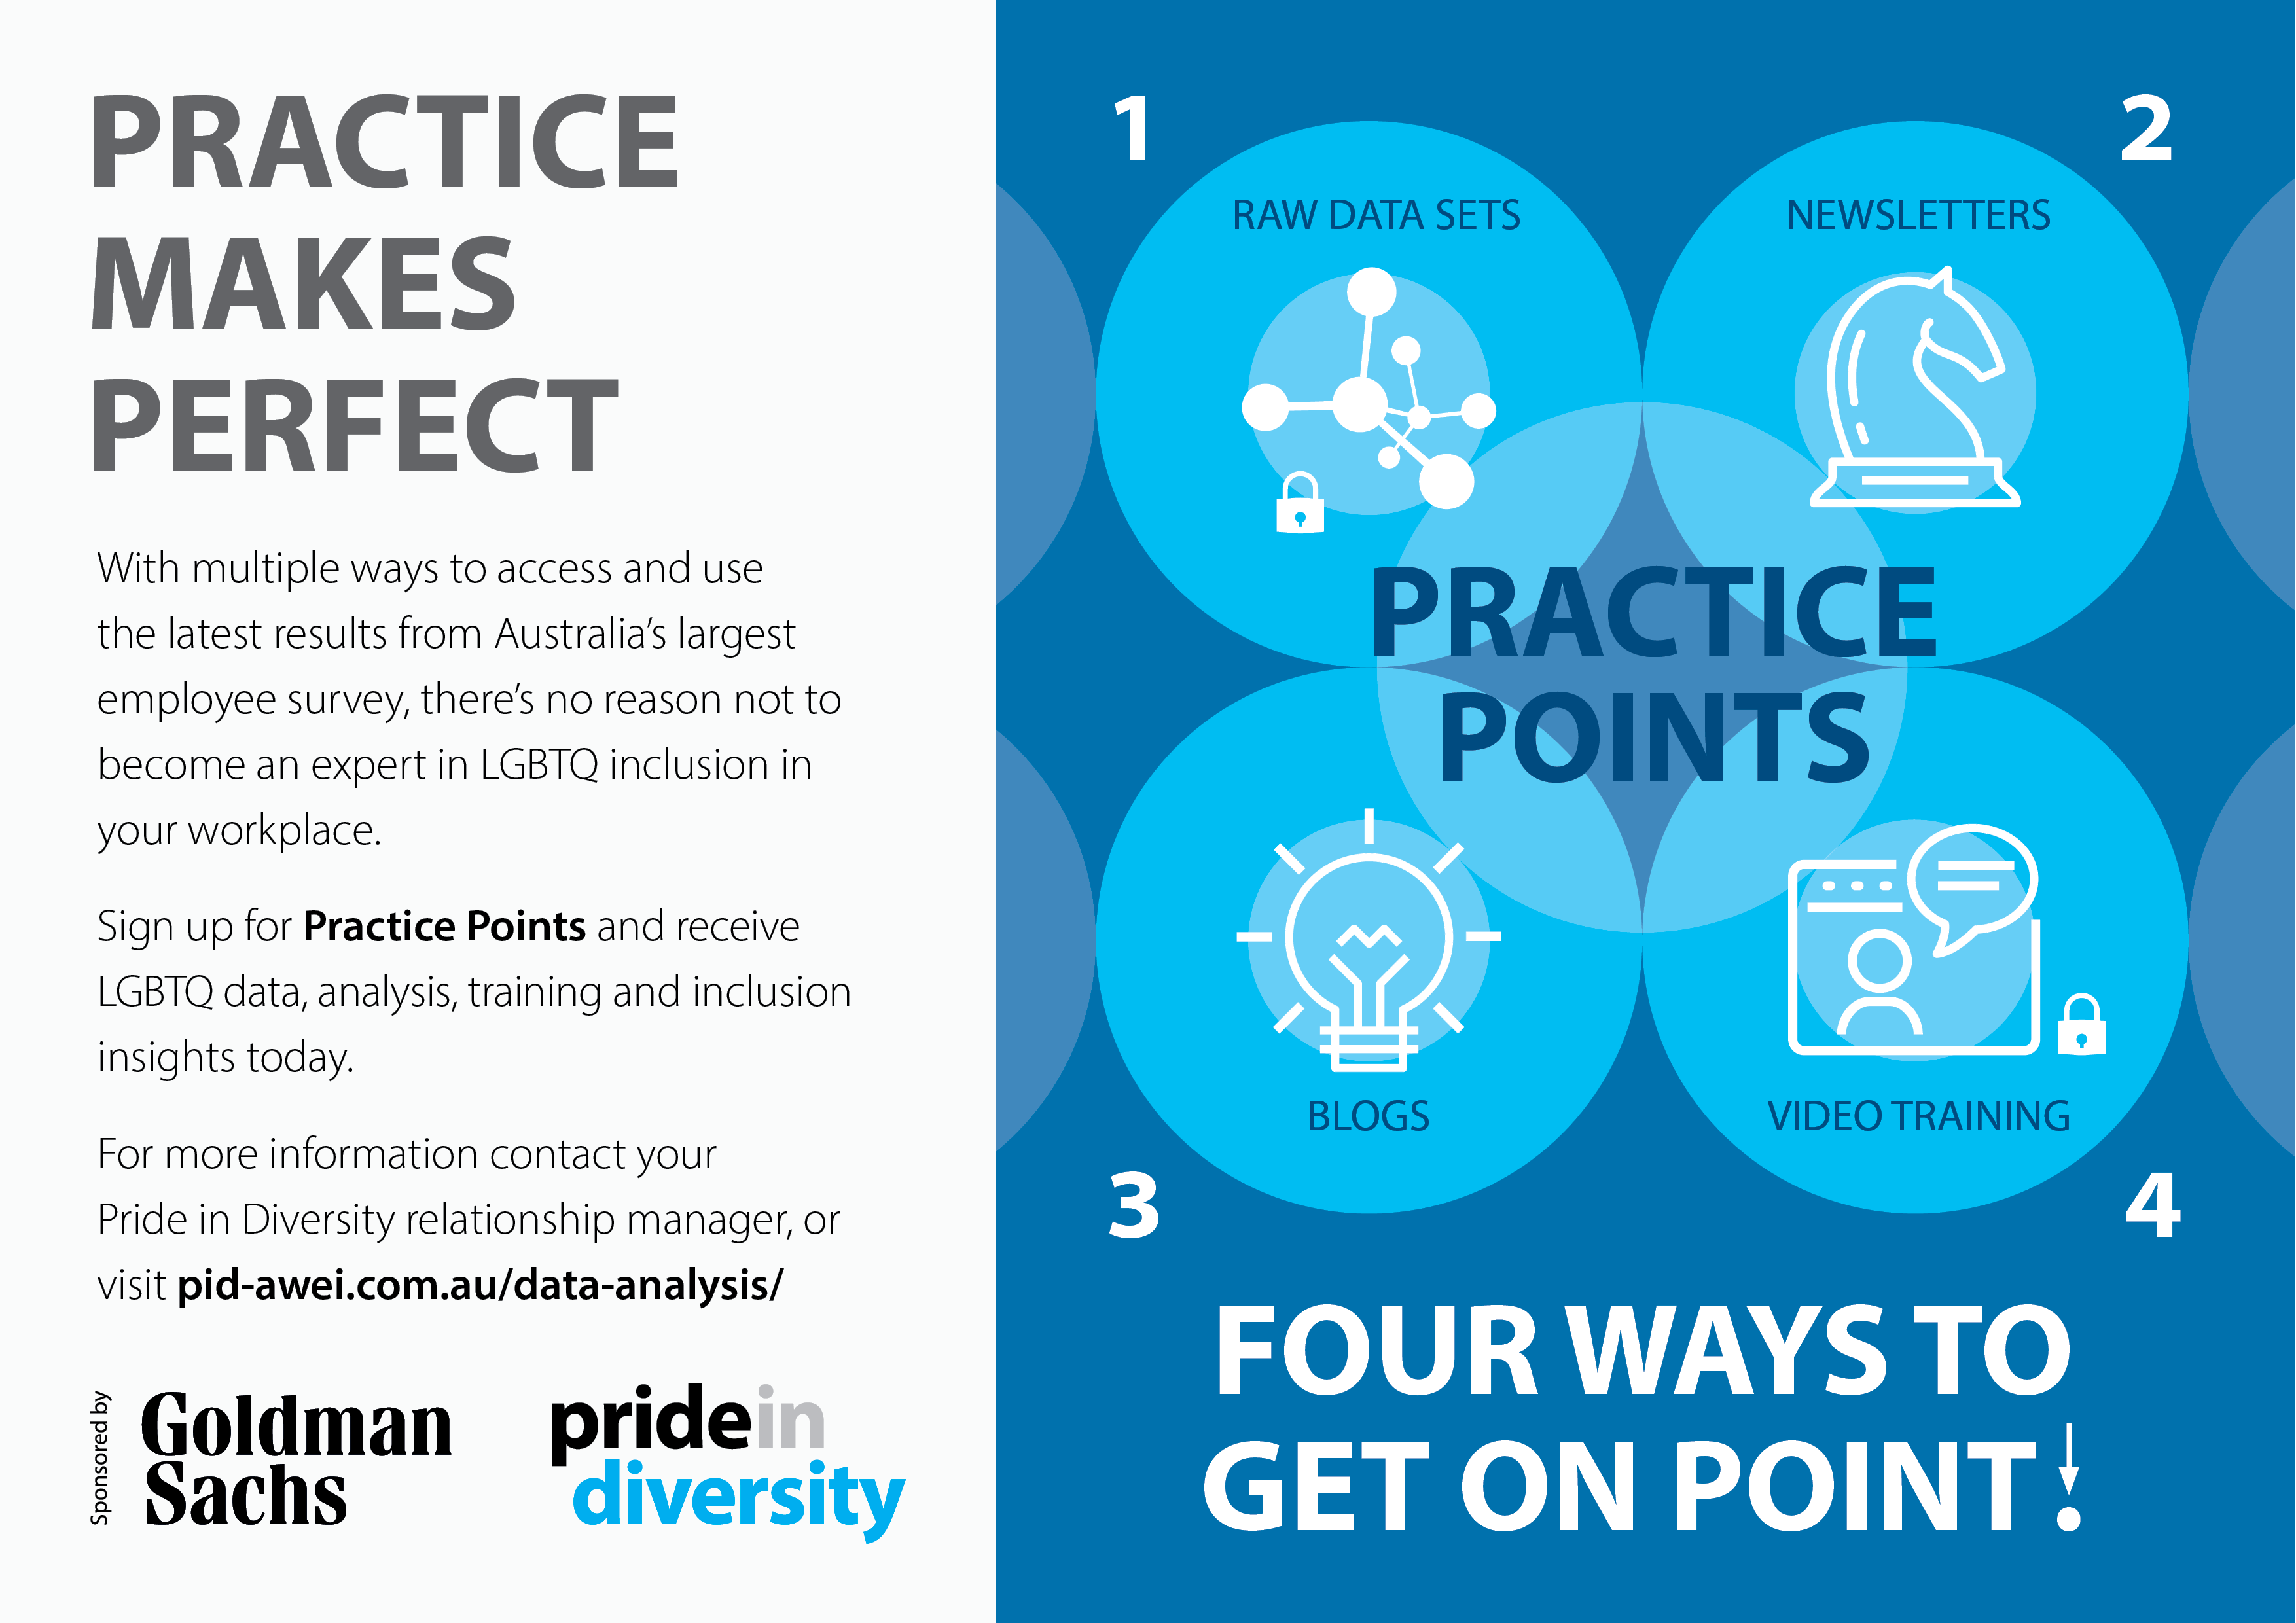
Welcome to the new AWEI Practice Points – evidence-based LGBTQ Workplace Inclusion Data 2021 and beyond!
For the last 10 years Pride in Diversity has published an annual benchmarking report (based on the results of Australian Workplace Equality Index) and AWEI Employee Survey report.
In surveying a random but large cohort of our membership, our finding was that while members utilised extensively their own AWEI Survey Reports, the AWEI Practice Points and the Benchmarking Tables, little reference was given to the annual hard copy “master documents”. What came out loud and clear was the value of the data that we offer and our strong evidence base.
So, the following factors influenced our decision to change, a need to:
Focus on what members clearly wanted – data, data, data and more of it!
Be environmentally conscious through the reduction of printed publications – we can reach more people online and eliminate superfluous hard copies.
Ramp up the AWEI Practice Points data sheets to extend the current ad-hoc data reporting to a multi-access system, providing:
our members with greater value add regarding their own LGBTQ inclusion work; and
non-members with an abridged version of what they need to know to progress their LGBTQ inclusion initiatives.
Continue with the strong evidence base that is supported by current Australian data and research. Our data is annual, not several years old or US/UK based – this space changes quickly (and the data needs to be local!).
Ramp up our academic alignment through partnerships with our academic advisors, the publishing of academic papers, and greater utilisation of the extraordinary data set which we produce annually.
Continue to promote incredibly strong evidence on Australian LGBTQ inclusion by sharing the invaluable resource we produce – to inform both our practice and yours, inform media, those in our industry and our international partners.
Thank You, Goldman Sachs!
Goldman Sachs has been the sponsor of our annual AWEI Benchmarking and AWEI Employee Survey publications for the last ten years. When we approached the Goldman Sachs team with the idea of this new direction for the AWEI Practice Points, they were delighted. Goldman Sachs immediately acknowledged this as an essential step forward in remaining both current, innovative and the number one resource for LGBTQ workplace inclusion in Australia.
Goldman Sachs have committed to supporting our work in this area with the shift from the financial support of our two hard-copy publications to the financial support of our revamped AWEI Practice Points and all the new features that this will entail.
I would like to thank Goldman Sachs for their continued support of our work and in enabling us to extend our evidence base for our members, to the public and our international partners. On behalf of all us here at the Pride in Diversity team, Pride Inclusion Programs Division and ACON more broadly, we thank you!
So, what is going to change?
To determine the change needed, we needed to answer the following:
How do we continue to add value to our membership with membership-only insights?
How do we provide non-members, media and those working within inclusion insights outside of membership to extend the work and message of inclusion in Australia?
How do we increase our alignment with universities, provide greater analysis of this rich source of data and publish more academic articles utilising the AWEI benchmarking results and employee survey data?
Our answer:
Increase regularity of offerings in this space.
Offer members exclusive access to Zoom training on each of the AWEI Practice Point topics – deep-dive insights with ongoing access to recorded content.
Offer members exclusive access to raw, de-identified data (where relevant) as it pertains to the topic area being discussed.
Make available to the public, international partners and media these published deep-dive insights (AWEI Practice Point data sheets) via our AWEI website and AWEI Practice Points mailing list.
Increase our engagement with academic advisors, and contribute to academic articles and research utilising AWEI data.
So, this is what you’ll see:
Pride in Diversity members, on request, will receive de-identified high level raw data that support the practice points that we are discussing enabling them to utilise data for comparison against their own Survey results.
Blogs – written by Director, Dawn Emsen-Hough highlighting discussion points around each of the deep dives will be available publicly, posted on LinkedIn and via our social media sites.
Zoom training on each of the Practice Points data sheets/Newsletters available to members for live participation or via recording. The lock in this image identifies added value for Members only.
So, how do you make sure that you are on the receiving end of this data?
Great Access to LGBTQ Workplace Inclusion Benchmarking & Annual Survey Data
written by Dawn Emsen-Hough, Director, ACON's Pride Inclusion Programs | 13 September 2021
Every year, Pride in Diversity facilitates the Australian Workplace Equality Index (AWEI), the national benchmark for LGBTQ workplace inclusion in Australia; and accompanying it, the largest annual employee survey that focuses specifically on the impact that LGBTQ inclusion initiatives have on employees working for organisations active in this area. This year 44,915 respondents participated in the survey. This blog seeks to identify, at a high level, why this area of D&I (Diversity & Inclusion) is benchmarked, why the single-focus surveys are valuable and how you can now gain greater access to its findings.
Why do we focus on just LGBTQ?
While we recognise that LGBTQ inclusion is only one area of an organisation's overall D&I strategy, it is the area that Pride in Diversity specialises in as the national not-for-profit employer support program for LGBTQ inclusion in Australia. There are numerous not-for-profits supporting employers in other aspects of D&I (such as disability, mature age, cultural diversity, RAP programs) each producing similar instruments and insights; each providing in-depth analysis within their areas of their expertise and focus. There are also some instruments that provide a high level, broad sweep analysis of D&I which can be beneficial but typically exclude the depth, challenges, views and/or inhibitors that are specific to a particular group within the population.
The AWEI benchmarking tool is a free tool open to all employers. The accompanying employee survey is open to all Pride in Diversity member organisations and those participating within the AWEI (membership not required for AWEI participation). While the benchmarking tool and accompanying survey provides a holistic approach to understanding the impact of your inclusion initiatives, each can be utilised independently. This combined collection of data provides a holistic analysis of the effectiveness of inclusion initiatives from both the business and employee perspective. Employers gain invaluable insights into the effectiveness and impact of their work in this area in addition to how these initiatives are perceived, valued and/or supported by their employees.
The impact of inclusion initiatives across the multi-faceted areas of diversity and inclusion have been positively outlined in academic and business papers alike, providing they are done correctly, not tokenistic and supported throughout the workplace culture.
The Australian Workplace Equality Index identifies a broad range of assessment areas that we know send a positive message of inclusion to LGBTQ employees while ensuring that policies and processes are not unintentionally discriminatory or exclusive in nature and most importantly, aligned with current discrimination law and best practice. The instruments look at the impact on workplace culture, the visibility of work in this area and the impact on both LGBTQ and non-LGBTQ employees alike. The instrument provides a very clear roadmap that employers can follow, covering not only the basic necessities for an LGBTQ inclusive culture but also areas that address current issues or roadblocks faced by people of diverse sexuality and/or gender. At times, it may focus on a particular demographic within the LGBTQ population to address areas of inequity that we know concerns not only the majority of employees within that demographic but also prospective employees looking to join the organisation. The index evolves as practice evolves and aligns itself not only with best practice here in Australia, but also diversity practice within business overseas. This is particularly important to global corporations, those who work international assignments and those managing talent programs that rotate staff between international offices.
Active vs Inactive Data Alignment
The rich source of data generated by the AWEI Employee Survey annually provides many employers with insight into the views of working Australians currently employed by organisations active in this space and while this data is useful, if your organisation is not participating in the survey, it's not YOUR data.
It is important to note that the information you get from a survey administered by an LGBTQ employer support program will be very different from a survey you administer internally. Internally administered surveys may miss significant areas of investigation, are typically high level and often do not tackle the nuances of a target population. Nor will internally administered surveys have the national response set against which you can benchmark each and every question. For example, the percentage of your LGBTQ employees who feel comfortable enough to be out at work becomes even more informative when compared to industry averages, groups, relevant sectors or the national average.
The same applies to the work you do in inclusion. This area of D&I is still evolving. It's not difficult to fall into the trap of looking at what you are doing and believing that it will suffice or meets employee and business expectations - but how does your work compare to that of your industry peers, competitors or ever-changing employee expectations.
Diversity initiatives do not represent fluffy HR rhetoric or merely focus on political correctness that some antagonists claim but rather tackle very real issues for business. We can cite corporate social responsibility but also need to keep in mind changing employee expectations, alignment with discrimination laws, employee value proposition, risk mitigation for people managers, the ability to attract and retain talent and the health, wellbeing, engagement and professional alignment of your staff.
Keeping on top of the data
We have for many years provided annual publications outlining industry and sector benchmarks for inclusion along with high level survey response stats. This information, summarised and completely de-identified has always been publicly available on our website (www.pid-awei.com.au) but has only typically been distributed to member organisations. Understanding the significance of 45,000+ responses annually, alongside benchmarked data on workplace policies and practices, we will shortly be launching Practice Points 2 which will not only provide much broader access to the data but will see us:
regularly analysing key findings to determine the overall support for inclusion initiatives, the changing expectations of employees and the impact of initiatives on workplace culture
focusing on particular areas of interest for example, those comfortable being out at work, the inclusiveness of a workplace culture, LGBTQ women, visibility of inclusion initiatives, regional reach; expectations of graduates and leadership
Using this information to determine the impact of work on both supportive and non-supportive employees alike, those who identify as LGBTQ and those who do not;
Providing greater visibility of what still needs to be an area of focus, what is working well and what we can do better
In addition to:
providing raw, de-identified data for inclusion in academic papers;
engaging with academics for a more active academic scrutiny of our findings;
partnering with universities in joint research projects/publications.
While we will be extending and promoting widely the data that will be publicly available to all D&I practitioners, executive sponsors, network leads, media and/or interested parties, members of Pride in Diversity will also enjoy additional benefits with easily accessible training in each of the focus areas and access to de-identified, high level, raw response sets that can be utilised within internal data programs to benchmark against their own data.
To be kept up to date with the Australian data set on LGBTQ workplace inclusion or for more information on the benchmarking and survey instruments, please visit www.pid-awei.com.au. Alternatively you can receive all data updates by joining our Practice Points Mailing Lists by clicking here.
We look forward to launching Practice Points 2 in the coming months.
The Australian Workplace Equality Index National Engagement Survey 2021: Higher Education Observations
written by Brett Atkinson, Senior Relationship Manager, Pride in Diversity | 4 August 2021
Introduction
The 2021 AWEI staff survey marked a year of considerable disruption. Amidst the Covid-19 pandemic, its economic fallout, and the ensuing retreat into our houses during lockdowns, organisations not only continued to participate in the AWEI benchmarking and survey, but also participation rates reached a new peak. AWEI 2021 saw a total of 161 submissions, and the survey recorded 44,915 respondents, a remarkable increase of nearly 34% from the previous year.
The data this year show a consistent positive link between inclusion in the workplace and employee general well-being. We have all seen anecdotal evidence that companies can actually generate returns for their shareholders or value for their stakeholders when they strive to achieve best practice in diversity and inclusion (“D&I”). But no matter the company or industry type, there is a reluctance to dive in headfirst, with many having to balance the needs and sensitivities of a broad employee base.
The AWEI benchmarking tool attempts to measure the LGBTQ+ inclusivity of workplace policies and practices, while the survey measures the results or impact of such policies and practices. Now in its 11th year, the survey has matured to include more in-depth indicators of inclusion and reflects the rapidly changing behaviours and attitudes of society. The information below is relevant for the Higher Education sector.
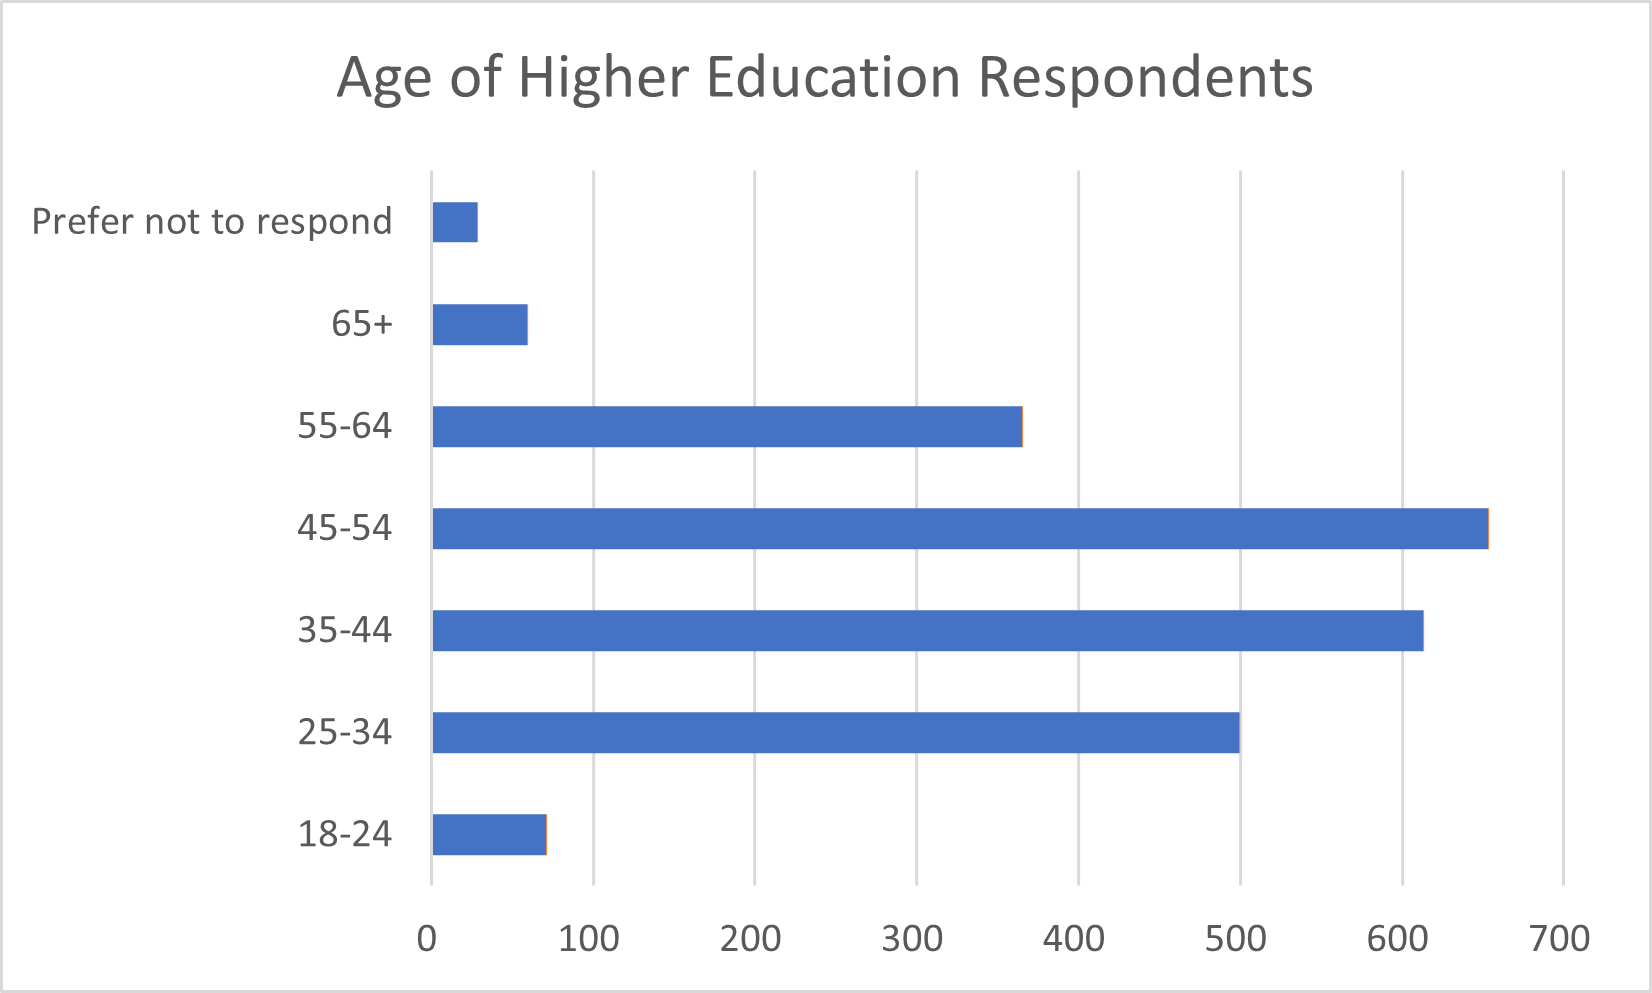
Age of Respondents
Response rates and respondents
The 2021 survey saw a lower response rate compared to the previous year with 2288 compared with 2902 in 2020. The locations of respondents vary with the majority of people coming from NSW (36.67%) and WA (35.45%). There has been a significant shift from the 2020 survey relating to Victoria with only 13.46% of people completing the survey from this state compared to 36.13% in 2020.
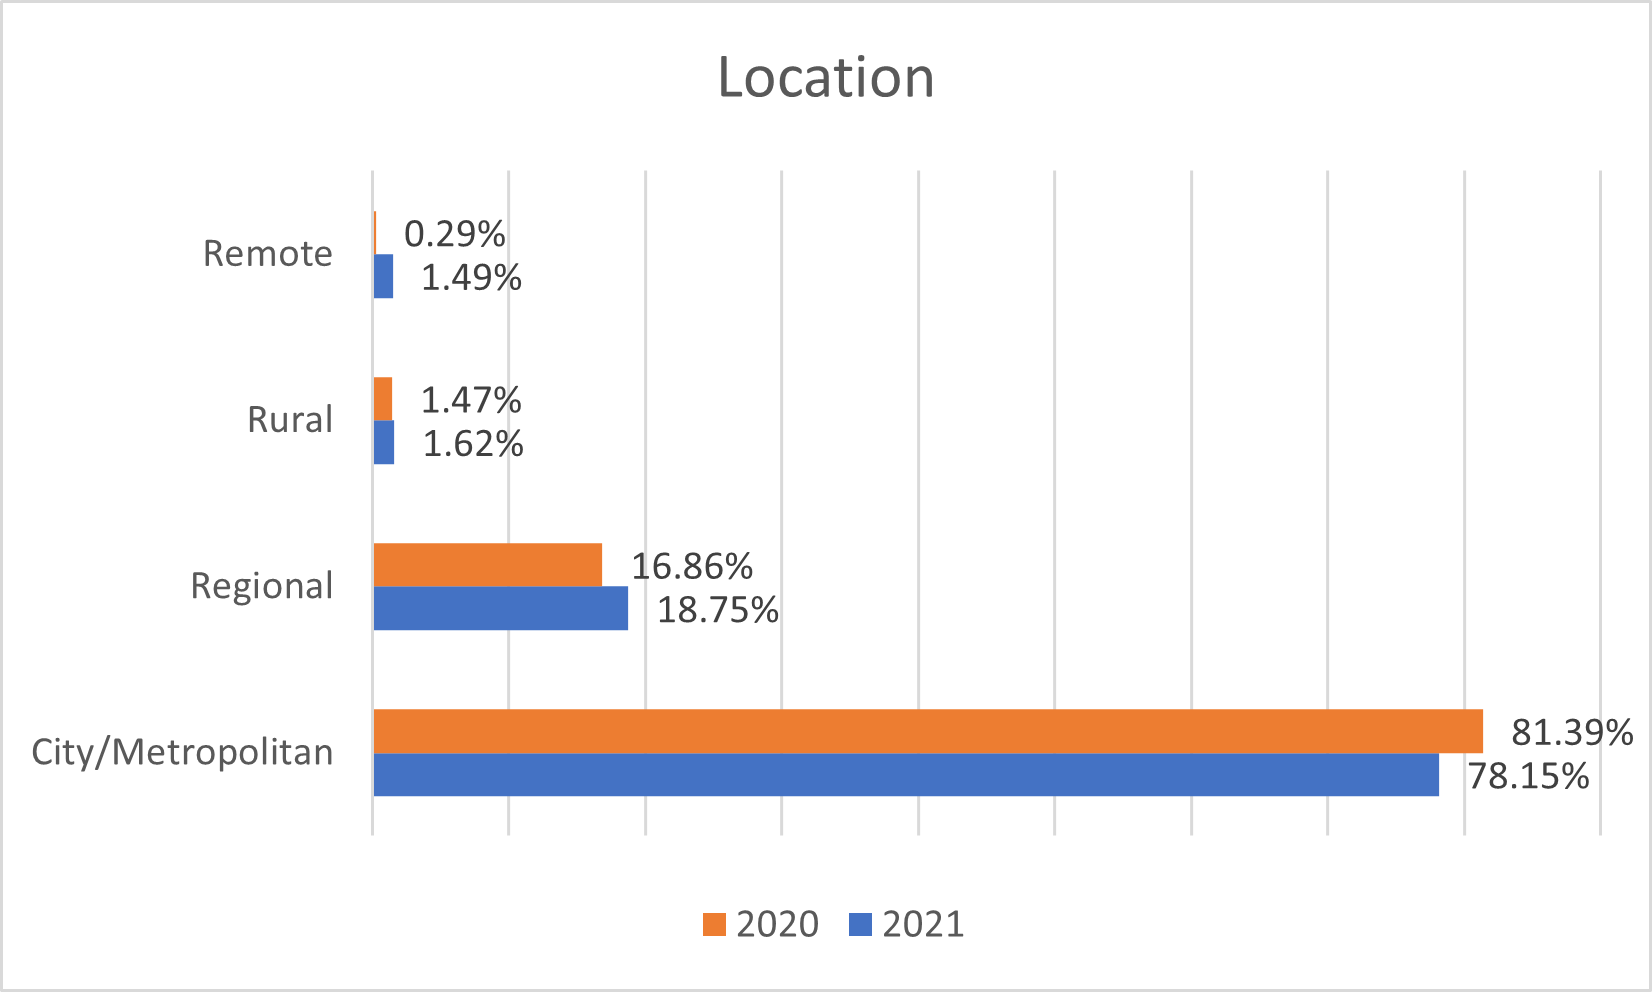
In relation to the location of where people are employed who completed the survey, there is a slight shift to Regional from City/Metropolitan.
GLBTQ inclusivity within the Higher Education sector
When completing the survey, we ask people to consider their personal views when it comes to the inclusion of sexuality, and gender diverse people. In this cohort of people, 86% of people personally support the work their organisation does for the inclusion of employees, which is similar to all respondents, in which 85% say they also support the work they do across all sectors.
However, 51% of people in Higher Education believe their organisation should put more effort into this aspect of Diversity and Inclusion compared to the national survey of 42%.
When asked about jokes and innuendo being acceptable in the workplace and being called out or addressed in the workplace, there is no significant difference between the Higher Education sector compared to all respondents.
In relation to Awareness or Ally training being made available to people throughout the year, 73% strongly agreed or agreed this was the case compared to 59% for all respondents.
When it comes to Allies, 68% of respondents in Higher Education know of active allies in their immediate work area compared to only 56% from all respondents. Yet there are not considerable differences when it comes to people knowing of executive allies or sponsors within my organisation (56% vs 54%). The common response as to why people are not active allies are people saying they are too busy (45%), but 50% of people said having more information on being an active ally when my time is limited, would influence them to become and active ally.
The inclusivity of the Higher Education sector relating to trans and gender diverse communities, we see higher levels of acceptance relating to gender neutral or all gender bathrooms. Compared to the national survey, Higher Education are more comfortable having all gender toilets on their floor (assuming male and female toilets are still available) 87% vs 79%, and more comfortable if all toilets were changed to all gender on our floor 56% vs 45%.
GLBTQ respondents
In relation to sexual orientation, less people identified as Gay/Lesbian (51%) compared to other sectors (54%). Higher Education experiences lower forms of bullying and harassment compared to the national survey and also being the target of unwanted jokes, innuendo and commentary as a direct result of my sexuality. Workplace inclusion initiatives for diversity of sexuality and gender have had a positive impact on how I feel about my own sexuality are slightly lower for this sector compared to the national AWEI data 56% vs 60%. For the Higher Education sector there is a decline from 2020 in the number of people who are out to everyone.
Conclusions
The survey results compare similar for the Higher Education sector compared to the survey results from all respondents across most of the questions. Like other sectors, there needs to be more work promoting the need for active allies in the workplace, and building on executive allies. There needs to be more work done in relation to people feeling they can bring their whole selves to work as this area is lower than the national responses (36% vs 41%).
The Australian Workplace Equality Index Employee Survey 2021: Retail Industry Observations
written by Christopher Nelson, Senior Relationship Manager, Pride in Diversity | 22 July 2021
Response rate and respondents
There were 1,549 responses from the retail sector or about 3% of the total responses. Considering the number of employees in Pride in Diversity’s retail members, this is a very small proportion.
42% of responses came form employees based in NSW with the next highest in Victoria (24%). The vast majority of responses came from metropolitan areas (88%) and of those most were full-time employees (71%).
Most respondents were team members (41%) which is equivalent to all respondents, although a higher number of respondents were in leadership roles. The age demographic of retail respondents was, understandably lower. Those aged under 18 years of age were 11% compared to only 5% of all respondents. Those aged 45 and above made up only 24% of retail respondents but 40% of all respondents. Expectedly, women made up 59% of retail respondents as opposed to only 54% of all respondents. There was little difference in rates of non-binary genders.
GLBTQ inclusivity within Retail
The Retail responses gave an overwhelming 90% affirmation in supporting the work that their employer puts into LGBTQ inclusion, which is higher than the 85% recorded for all respondents. There was a similar difference in support recorded for thinking that this was an important space in which to be active.
Likewise, there are more visible signs of support for LGBTQ inclusion in retail employers (84% agree or strongly agree) whereas only 78% of all respondents agree or strongly agree that there are visible signs of support.
Retail employees indicate that they understand some of the unique challenges that LGBTQ employees face in the workplace (89%) whereas only 84% of all respondents are aware of these challenges.
There is little difference between the Retail sector and all respondents in the witnessing, prevalence and addressing of LGBTQ jokes/innuendo and more serious bullying and harassment, however the Retail sector is better on all scores.
Allies for LGBTQ employees
There are more respondents in the Retail sector who identify as active allies for LGBTQ employees in the workplace (24%) as opposed to 20% for all respondents. LGBTQ respondents in the Retail sector are more likely to be active allies for others in their community (58%) than all LGBTQ respondents at 51%.
Active allies are better known in the Retail sector (63%) compared to 56% overall, but executive allies are less well recognised at 51% in Retail and 54% across the board.
The highest reason for not being an ally in Retail and in all responses was that people were too busy (38% in retail and 42% for all) although 25% of all respondents had no personal interest in LGBTQ inclusion, whereas only 20% indicated that in the Retail sector.
48% of Retail sector respondents would be influenced by a better understanding of how to be an active ally as opposed to only 40% of respondents overall. Only 26% of Retail sector respondents said nothing would influence them to become an active ally; thankfully much lower than all respondents at 32%.
GLBTQ respondents
The retail sector respondents were higher in their identification as LGBTQ at 24% as opposed to 19%, which is significant.
A higher percentage of Retail respondents identify as gay or lesbian (65% vs 55%) as for all respondents.
On being out about sexual orientation in the workplace, Retail sector respondents are considerably more comfortable being out to all, at 53% compared to 41% for all respondents. 90% of Retail sector respondents say that they have not encountered any exclusion based on their sexuality compared to 83% for all respondents.
For those respondents not out at work, 53% say that they feel that they would not be accepted by their colleagues (39% for all respondents) and 41% say that they are not comfortable within themselves to out at work, compared to 38% for all.
In terms of the impact of active allies, 60% of LBTQ retail respondents indicate that there has been a positive impact on their sense of inclusion compared to only 49% for all respondents. There are fewer Retail respondents identifying as bisexual than overall (17% vs 24%).
Conclusions
We need to encourage greater participation by employees in the retail sector in the AWEI. Low participation rates make drawing strong conclusions from the data difficult.
The fact that most retail respondents were based in metropolitan centres (88% vs 82% for all), may indicate that the survey is yet to penetrate the regional and rural retail shopping centres and stores. It would be desirable to see the regional, rural and remote participation rate of respondents increase over time, to include more workers on the shop floor, rather than office locations.
More work needs to be done across the board to turn passive allies into active ones, which means more education on why allies are important and how people can be active allies while having busy jobs. Senior leaders have an important role in this by speaking publicly with their own ally stories.
Although the Retail sector rates higher than the average on being out at work, if you are sexually diverse, the fact that more young and new employees feel unable to be themselves in the workplace requires greater visibility of LGBTQ inclusion. The assumption is that people of a younger age demographic will explore and come to terms with their sexual and gender diversity. The younger age demographic of retail employees makes the role that retail employers have more significant in promoting and normalising LGBTQ inclusion.
The Australian Workplace Equality Index National Engagement Survey 2021: Professional Services Industry Observations
written by Jess Mayers, Senior Relationship Manager, Co-Convener Sapphire Programme, Pride in Diversity | 9 July 2021
The 2021 engagement survey saw over 2,200 survey respondents from organisations within the Professional Services & Consulting sector (PS&C). The analysis does not include those professionals employed in other sectors. Of these, 401 participants identified as being part of the LGBTQ community (17.75% vs 18.8% of the national cohort).
Demographics
Regarding the demographic segmentation of the survey participants, this sector differs from the national mix in several significant areas:
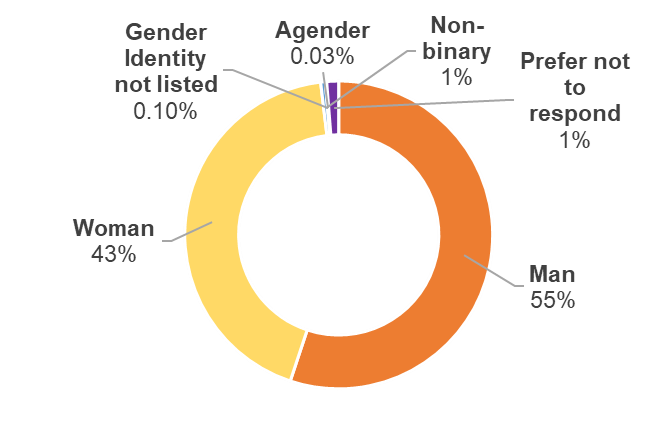
Has more representation of men (49.49% PS&C vs 43.13% nationally), and less of women and non-binary people (48.34% vs 54.22% and 1.06% vs 1.25% respectively)
Has more employees with bachelor and post-graduate degrees (84.73% vs 63.77%)
Over-represented by people working in city/metro areas (91.54% vs 81.13%)
Over-represented by people in senior management positions (13.7% vs 7.5%)
The sector also appears to be under-represented by:
Aboriginal and/or Torres Strait Islanders (0.67% vs 2.44%)
People living with disabilities (2.84% vs 4.55%)
Neurodiverse people (2.84% vs 3.97%)
Mature age employees (11.14% vs 16.19%)
General Populations View on LGBTQ Inclusion
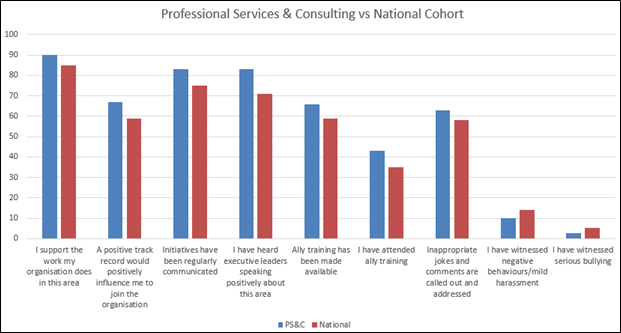
When looking the work organisations are doing in this area and how the workforce views those initiatives, the responses of PS&C employees tracked ahead of the national response.
There is broad support for the work being done by PS&C organisations, and overall, there seems to be good communication plans in place, both generally and from executives.
While responses about training do track better than the national response, there is still work to be done in offering training, and then in the promotion of sessions and in giving employees the freedom to attend during work hours.
Health & Wellbeing
Health and wellbeing indicators were equally to or slightly higher than average:
80% of respondents feel mentally well at work (vs 78%)
86% feel they can be themselves at work (vs 81%)
80% feel a sense of belonging (vs 77%)
Business case indicators were also on par with 90% of participants feeling productive (vs 88%) and 83% feeling engaged (vs 81%).
Active Allies
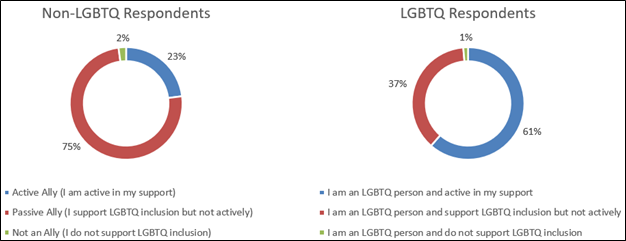
When it comes to active allies, the sector matches the national profile, with 29% of total respondents describing themselves as active allies, compared to 28% nationally. LGBTQ people are almost three times as likely to be an active ally than non-LGBTQ respondents.
Allies are more visible within PS&C than the national cohort, with 63% of respondents saying they know of allies within their work area (56% nationally). Executive allies are also more visible, with 67% of PS&C respondents knowing of active exec’s compared to just 54% nationally.
For people who support LGBTQ inclusion but are not active, the main reason given was ‘too busy’. The provision of information on being an active ally when time is limited is likely to be far more influential in this sector.
This is an important group of people, and potentially means many can be ‘activated’ with the provision of targeted education/resources.
Workplace Experience of LGBTQ People
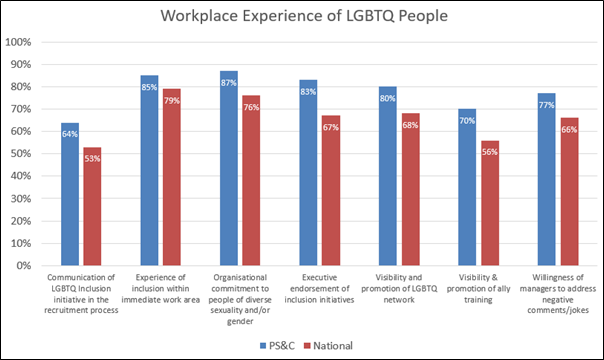
The experiences of LGBTQ employees participating in the survey from the professional services and consulting sector is more positive than the national cohort across the board, with organisations meeting or exceeding their expectations in every area asked about.
It is pleasing to see that, for LGBTQ employees, visibility of active allies is higher than the national cohort (71% vs 57%), and in turn, the visibility of active allies has positively impacted their sense of inclusion (64% vs 49%).
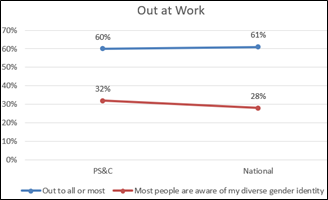
However, despite the seemingly more positive experiences, LGBTQ employees within PS&C report similar levels of being ‘out’ in their workplaces as the national cohort.
It is worth noting for people with a diverse sexuality, the number of people who are completely out in the workplace has been decreasing since 2019.
Again, the experiences of those employees with a diverse sexuality who are out in the workplace are reported as being better in the PS&C sector compared to the national cohort:
I would feel supported by my organisation to come out to suppliers, customers, or external business contacts (84% vs 78%)
I have not encountered any exclusion based on my sexuality within the organisation (91% vs 83%)
My sexuality would not have any impact on my career progression (86% vs 81%)
My performance is positively impacted by being out (80% vs 66%)
My overall engagement is positively impacted by being out (86% vs 73%)
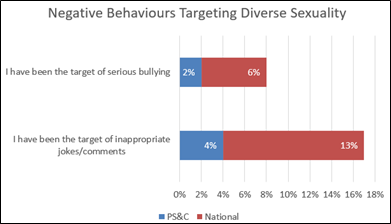
When comparing negative behaviours, employees with a diverse sexuality who are out in the workplace experience both inappropriate jokes and comments, and more serious bullying at lower rates than the same cohort at the national level.
One of the more significant variations from the national indicators was whether workplace inclusion initiatives (for diversity of sexuality and gender) have had a positive impact on how they felt about their sexuality. 82% agreed on this point, whereas nationally only 60% did.
Regarding not being ‘out’, the reasons why tended to be similar to the national cohort. The main reasons given were:
Not comfortable within myself to be out at work (39% of both this sector and the national cohort)
I do not feel I would be accepted by some members of my team (29% PS&C vs 39% national cohort)
Being out at work would be detrimental to my workplace experience (25% vs 33%)
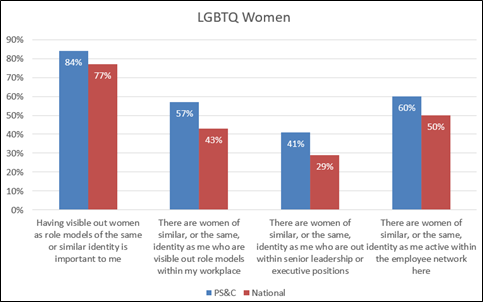
LGBTQ Women
While the results of LGBTQ women working in the PS&C sector again track ahead of the national cohort, there is still a gap between women looking for a role model, and seeing LGBTQ women acting as out, visible role models and within leadership positions.
Trans and Gender Diverse Inclusion
Encouragingly, 72% of gender diverse employees in this sector saw visible organisational inclusion for gender diverse employees (vs 58%), but some practical measures, while better than the overall national results, indicate support for trans and gender diverse employees is still lagging:
53% of respondents reported they had freedom to use toilets of choice (vs 42%)
48% reported some alternatives to gendered dress codes or uniforms (vs 41%)
52% report their organisation acknowledges gender diversity beyond the binary of male/female (vs 47%)
Almost all areas looking at the experiences of TGD employees show that their experience overall is poorer than that of employees with a diverse sexuality.
This includes 1.2% of people being deliberately misgendered, 6% of people being targeted with unwanted jokes, innuendo, commentary as a direct result of their gender diversity, and 4% being the target of more serious bullying/sexual harassment ( vs 8%, 8% and 6% respectively).
65% can freely use gendered toilets of choice without opposition (vs 49%)
65% report people make an effort to use their personal pronouns (vs 58%)
76% have not experienced any exclusion based on their gender diversity (vs 66%)
73% report their gender identity has not had any impact on their career progression (vs 64%)
75% say workplace Inclusion initiatives for diversity of sexuality and gender have had a positive impact on how they feel about their own gender diversity (vs 56%)
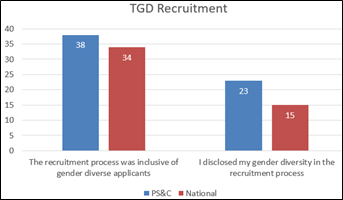
The data around recruitment also shows there is still some work to be done in this area. While the process felt slightly more inclusive for applicants in the PS&C sector, the percentage of applicants that found it inclusive was still low, and so this should be a focus for organisations in the future.
Regional Inclusion
While there are few regionally/rurally based employees within this sector, those who are report higher levels of inclusion than the national cohort. For example, 68% report their organisation's diversity initiatives for the inclusion of people of diverse sexualities or genders have been adequately communicated within their site/office (vs 59%), 61% report being easily able to connect into head office activities for this area of diversity & inclusion (vs 46%), 45% report having a local person/champion to help drive sexuality and gender diversity inclusion initiatives (vs 35%).
Summary
Overall, the Professional Services & Consulting sector tracked well ahead in any areas than the national cohort. Communication, visibility, and exec endorsement all ranked highly amongst the LGBTQ cohort, and there seemed to be broad understanding and support from the total PS&C cohort for the work being done.
Areas that should be focused on are the provision of training, including the promotion of and encouragement to attend, inclusion for trans and gender diverse employees and recruitment applicants, and increasing the presence and visibility of LGBTQ women. While the majority of employees work in metropolitan areas, the support of regional employees should also be a focus of future strategies.
The Australian Workplace Equality Index 2021: Legal Industry Observations
written by Mark Latchford, Associate Director, Pride in Diversity | 6 July 2021
The Australian legal firms were early engagers in LGBTQ specific inclusion initiatives within their workplaces and this is reflected with a generally positive analysis from the AWEI in 2021. From the perspective of their LGBTQ employees, their allies and the wider workforce, the organisations collectively seen to be doing a more positive job than the national survey cohort. Nevertheless, the preparedness to be out to everyone or most has seen a significant year-to-year decline in the legal sector. Moreover, for attracting and retaining gender diverse talent, there is particular work still to be undertaken, based on what can be seen from the survey.
Demographics
Nearly two thousand members of the legal sector participated in this year’s survey, which was nearly exactly the same number who participated in 2020 (although the total national participation increased by over eleven thousand to nearly forty-five thousand). 43% of the legal fraternity indicated they had participated in the previous survey.
Not unexpectantly, the sector was over-represented with those resident in NSW and Victoria and under-represented from those from the smaller states, especially Western and South Australia. The location of the respondents was heavily skewed to metropolitan locations. Interestingly, 15.1% indicated they worked part-time, which compares to only 10% of the national cohort.
The legal community who were surveyed tended to be relatively newer employees to their current organisation (48% had worked less than three years at their current employer as compared to 34% of the national response). This was also reflected in the relative youth of those surveyed with 9% under 24 years of age and 39% between 25-34, while the national cohort recorded 5.3% and 24.5% in these age ranges. Conversely, older people (ie 45 years and beyond) made up 24.8% of the legal sector as opposed to 40% nationally.
Significantly, the legal sector participation was skewed to women who represented 67% of the respondents (whereas that number was 54% nationally). The national and legal sector percentages who indicated there were of diverse sexuality or diverse gender were similar (18.8% nationally and 17.9% in legal).
Legal sector participants claimed to be more senior than average (for example, 11% claimed to be in senior leadership and/or CEO or reporting to CEO, compared to 7% nationwide). As you would expect, the legal sector is well represented with those with higher levels of education (with 41% having a bachelor degree (32% nationally) and 24% with postgrad degrees (22% nationally).
Finally, the sector was better represented than the national cohort with people of colour; and people with a culturally and linguistically diverse (CALD) background but underrepresented by Aboriginal and/or Torres Strait Islanders; people living with a disability; people who are neuro-diverse and also mature age employees.
The wider employee community and their responses
Overall, the wider legal community in the workforce appears to have a more progressive point of view about LGBTQ inclusion. For example, 91% of these respondents felt that romantic relationships were just any other and 63% believed there was more than two genders (By comparison, these numbers were 87.7% nationally and 54.6% nationally). Critically, the wider population (70%) felt an organisation’s track record in this aspect of inclusion would positively influence them to join an organisation. (In the wider population, that number was lower at 59%). Moreover, 91% felt work in this aspect of diversity and inclusion had a positive influence on organizational culture, nine points above the national percentage believing the same thing.
Seeing the focus on inclusion; understanding of why this work was being done; communication of initiatives, including visible signs around LGBTQ inclusion; availability of information and others indicators showed significantly better results in the legal sector than the national average. Of particular note is a very high (82.6%) acknowledge that executives in legal firms spoke positively about LGBTQ inclusion (compared to only 70.5% nationally).
Availability of awareness or ally training was noted by nearly 76% of the legal community (only 59% nationally) and nearly 46% has attended such training (as opposed to only 35% nationally).
This group also confirmed inappropriate language was not acceptable (96%) but only 61% thought it would be called out or addressed. Comfort with using different names and pronouns post a colleague’s affirmation was high at 94% (vs 88% nationally) as was the comfort with having ‘all-gender’ bathrooms on the floor (85% vs 79% nationally). It one of the few areas where the legal sector’s position was (marginally) lower than the national cohort, was on the question of all toilets being ‘all-gender’. 44.8% were comfortable with that idea vs 45.2% nationally.
Finally, the willingness to be an active ally in the legal sector was a positive 27% (as opposed to only 197% nationally and those not supporting LGBTQ inclusion and therefore not an ally was a small 1.2% (over half the national number). The knowledge of active allies in the immediate work area was particularly strong at 76% (whereas the national number was only 56%). This corresponded with deeper knowledge about being an ally including understanding why allyship is important, knowing behaviours expected and also the location of resources. Visibility of active executive allies was particular strong in the legal sector at 76% (vs nationally 54%). When asked why there were not allies, workload dominated the reasoning at 46% (and only 4% saw a conflict with their beliefs or values whereas 9% of the national cohort had that conflict).
Inappropriate workplace behaviours
Of the wider employee community within legal, 10% had witnessed negative behaviours and mild harassment (lower than the national 14.3%) and 2.5% had witnessed more serious bullying of those with diverse sexuality or diverse genders.
The Business Case and the Wellbeing Case
The 2021 survey confirmed the value of inclusion work. 91% of legal respondents indicated they felt productive at work and 85.6% felt engaged at work, because of these initiatives (both indices higher than the national percentage). 93.5% felt safe and included at work and 81% felt mentally well at work. 85.8% felt they could be myself at work which compared to 80.8% nationally.
Meeting Expectations
As with other indicators, legal sector employers are fairing better than other sectors, in meeting expectations of the LGBTQ talent they seek to recruit or retain. When asked about the inclusion experience within the LGBTQ employees immediate work area, near 88% said their expectations were met or exceeded (78.5% nationally). Organizational commitment to inclusion for diverse orientation and diverse gender was rated at 84%, nine points above the national data point. Other areas looked at including communication, both during the recruitment process and ongoing; executive endorsement for inclusion; visibility and promotion of LGBTQ networks and willingness for managers to address negative commentary were on average, ten points above the national average. The visibility of active allies was assessed at a strong 73% (nationally only 57%) and also visibility of allied training at 76% vs 56% of the national feedback, indicated the systemic approach many legal firms have taken on taking the conversation forward is resonating. The value of this approach can also be seen in the fact that 65% felt Active Allies had positive impacted LGBTQ employee sense of inclusion (49% nationally) and that about 84% said they did not here jokes or innuendo in their workplace, relating to either sexual diversity or diverse genders.
Degree of Outness
The 2021 AWEI data suggests that despite the many better than average indicators referred to above, the degree of ‘outness’ in the workplace is similar to the national status. 42% of legal employees were out to everyone (40.54% nationally) and a further 18.5% out to most (20.1% nationally). 14.6% were not out at all (marginally less than the national figure of 15.9%).
However, there has been a negative movement in these indicators’ year-to-year. In 2020, 44.4% of legal employees were out to all and 22.6% out to most, so 67% generally out. This year, that indicators has dropped to 60.5% out to all or most, a significant year-to-year decline.
Despite this sobering news, other indicators confirm the value of being out. 92% feel their sexuality has not impacted their career progression (83% of the national cohort felt the same way) and 80.4% felt their performance had been positively impacted by being out at work (versus 65.7% nationally).
The degree that legal employees had been the target of unwanted jokes, innuendo and commentary was half the national rate (6.5% vs 12.7% which is similar to 2020 at 6.6%) and those who had been the target of more serious bullying and sexual harassment (based on their sexuality) was also over half the national rate at 2.4% (vs 5.6%). This is very positive movement from the 5% in 2020.
When those not out at work were asked, why not?, the main reasons where ‘I feel I would not be accepted by some members of my team’ (32.3%); ‘I am not comfortable enough myself to be out at work’ (28.3%) or ‘I feel being out work would be detrimental to my workplace experience’. This confirms the value of positive story-telling by members of the LGBTQ community within legal firms and communicating across the entire organisation, so as to reach out to those who are hesitant.
Focusing on Gender Diverse
It is primarily in the area of gender diverse talent that the legal sector is sometimes below the national average team members. 60 professionals in the legal sector participated in this part of the survey. This was particularly the case during the recruitment process when only 28% felt application forms were inclusive (36% nationally) and support contact persons were identified by 8.7% (9.5% nationally). 10.3% of this cohort still had fears of being discriminated at work because of their gender identity (as opposed to 23.06% nationally) which is still too high. Only 7% held a fear of being outed for their gender diversity, during the recruitment process whereas 13% felt the same way national).
Although visibility of gender diverse inclusion work was relatively strong in the legal sector (65.6% vs 58% nationally), the freedom to use toilets of choice (36%), availability of all gender toilets (18%) and the freedom to use gendered toilets without opposition (10%) were all well below the national indicators (n: 42%, 28%, 24% respectively).
A relative low number of gender diverse legal respondents (11.8% as opposed to 28.1% nationally) indicated that most people at work were away of their gender diversity yet only 12% said people made the effort to use the right personal pronouns (27% nationally). As such, only 27.4% felt fully supported by their teams in terms of their gender identity (35.6% of the national cohort said the same thing) and only 6% felt happy with the gender affirmation process undertaken within the workplace (well below the 26% feeling the same way nationally).
On the positive side being the target of unwanted commentary because of their gender identity was a low 2% (nationally 8.4%) as was being the target of more serious bullying at 4% (5.6% nationally). was low at 2%. However, only 29% felt safe and supported such harassment (versus 45% of the national gender diverse cohort).
Intersectionality in the Workplace
Despite strong participation by women in the AWEI survey from within the legal sector, the gender challenge within the industry was evident in a number of responses. The visibility of women role models for example was at 42.5% (slightly below the national 43.5%) yet having such role models was seen as important to nearly 82% of respondents. The good news is that legal employee networks are seen as being inclusive of women of diverse sexuality and/or gender by 77% (nationally only 68%).
Regional and rural based employees in the legal sector generally felt more positively about the state of inclusion (when compared with the national response) and in particular, they felt easily connected into head office activities (60% versus 46% nationally). A compliment to the communication strategies implemented by the firms.
Finally, those employees of colour or identify as culturally and linguistically diverse feel most accepted within legal sector organisations, whereas those persons of faith feel least accepted in the workplace. Food for thought in regard to a holistic approach to inclusion in the workforce.
The Australian Workplace Equality Index Employee Survey 2021: Engineering Industry Observation
written by Adrian F., Senior Relationship Manager, Pride in Diversity | 5 July 2021
Introduction
This year’s survey marked a year of massive disruption. Amidst the tragic Covid-19 pandemic, its economic fallout, and the ensuing retreat into our houses during lockdowns, organisations not only continued to participate in the AWEI benchmarking and survey, but also participation rates reached a new peak. AWEI 2021 saw a total of 161 submissions, and the survey recorded 44,915 respondents, a remarkable increase of nearly 34% from the previous year.
The data this year show a consistent positive link between inclusion in the workplace and employee general well-being. We have all seen anecdotal evidence that companies can actually generate returns for their shareholders or value for their stakeholders when they strive to achieve best practice in diversity and inclusion (“D&I”). But no matter the company type, there is a reluctance to dive in headfirst, with many having to balance the needs and sensitivities of a broad employee base.
D&I is wide and amorphous, and LGBTQ+ inclusion, covering broad population types, can notoriously be hard to define. Because of this, the AWEI benchmarking tool attempts to measure the LGBTQ+ inclusivity of workplace policies and practices, while the survey measures the results or impact of such policies and practices. Now in its 11th year, the survey has matured to include more in-depth indicators of inclusion and reflects the rapidly changing behaviours and attitudes of society. We hope that this analysis will sharpen the focus on areas where engineering companies can do more to support their employees to bring their whole selves to work.
Response rate and respondents
Figure 1: Age of Engineering respondents
Figure 2: Gender Identity of Engineering respondents
There were 3,041 respondents from the engineering industry this year, with the majority (32%) of respondents working in Western Australia, followed by 25% in New South Wales and 17% in Queensland. This contrasts with the overall respondents who mostly work in New South Wales (30%), Victoria (22%) and Queensland (15%). A large majority of respondents from the engineering industry work in the private sector (93%) compared to the overall number of 45%. Nearly half of engineering respondents were also team members or team leaders/supervisors (46%) with numbers tapering off as roles become more senior or junior, which is consistent with the overall respondent trend. Unsurprisingly, there were more respondents who identified as men (55%) in the engineering industry compared with the overall figure of 43%, and 43% of engineering respondents identified as women compared to the overall 54% figure (Figure 2).
LGBTQ+ Inclusivity
As many engineering respondents as overall respondents (~85%) support the work of their organisation does for the inclusion of employees with diverse sexualities and genders. Likewise, around 81% of engineering respondents think that it is important that employers be active in the area of LGBTQ inclusion, compared to the overall figure of 83%.
Visible Signs. 80% of engineering respondents were more likely to have heard a senior executive speak about LGBTQ inclusion, compared with 70% in the overall population. They were also slightly more likely (82%) to have seen visible signs of support in the workplace than overall (78%).
Jokes and innuendo.When asked about jokes and innuendo targeting LGBTQ+ people, similar numbers of engineering respondents (~92%) to the overall population agreed that they are not acceptable in the workplace, and 58% agreed that they would be quickly addressed.
Allies. When it came to allies, many more engineering respondents said that they were passive allies (75%) compared to 70% in the overall population. Fewer people said that they were active allies (21%) in contrast to the 28% overall. When asked to consider what would influence them in becoming an active ally, engineering respondents were roughly in line with overall respondents with around 40% of them wanting to know how to be active allies, and around 45% of them wanting more information on being active with limited time.
Employer inclusion practices.Engineering respondents of diverse sexuality and gender were also more satisfied with their employer when it came to employer inclusion practices in the workplace. They were more likely than the overall population to report that their employer exceeded or met expectations in the following key areas:
Experience of inclusion
Communication of inclusion
Level of executive endorsement
Visibility and promotion of employee network and allies
Visibility of active allies
However, respondents of diverse sexuality and gender in engineering were as likely as the overall population to report that they:
Feel comfortable bringing my partner to work events here
Recommend this organisation as an inclusive place to work for people of the same, or similar, sexual orientation and/or gender diversity
Do not hear jokes/innuendo targeting people of diverse sexuality and gender here
Any jokes/innuendo targeting people of diverse sexuality and/or gender are acted upon quickly here
Active Allies have positively impacted my sense of inclusion here
LGBTQ+ respondents
Figure 3: Sexual orientation of Engineering LGBTQ+ respondents
Perhaps unexpectedly, there were fewer engineering respondents (45%) who identified as Gay or Lesbian in contrast with the overall population figure of 55%. There were then more engineering respondents who identified as Bisexual (30%).
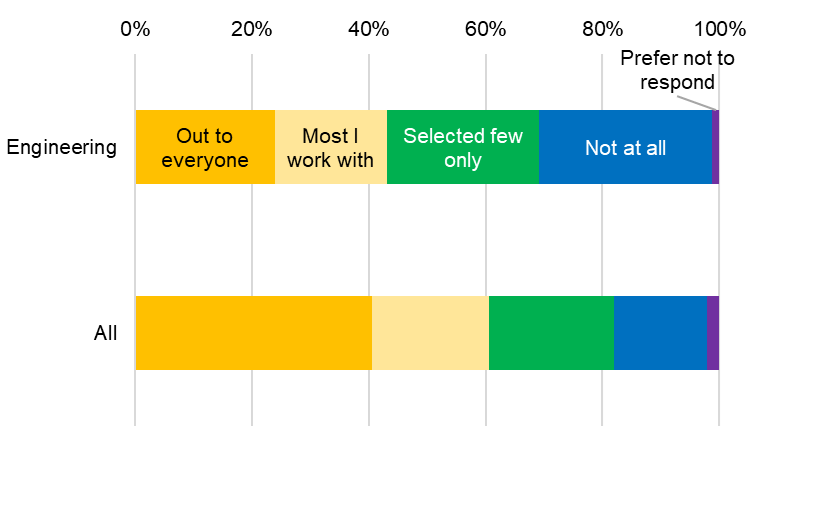
Figure 4: Proportion of people out at work
Being Out. When asked about being out at work regarding their sexual orientation, disappointingly far fewer people in the engineering industry report being out to everyone. Only 24% of engineering LGBTQ+ respondents say that they are out to everyone, compared to 41% in the overall population. They are also much more likely not to be out at all (30%) compared to 16% in the overall population.
Those who report being out at work still report being the target of jokes and innuendo because of their sexuality (~12%) both in engineering and in all respondents. However, a substantial proportion of engineering respondents who are out at work say that they will feel safe and supported reporting bullying and harassment to HR (92%) compared to 81% in the overall population.
Not Being Out. The top three rated reasons for not being out in the workplace in the engineering industry were:
Not comfortable enough within myself (41%)
Not feel I would be accepted (28%)
Being out at work will be detrimental to my workplace experience (26%)
Whereas the overall population rated ‘not feeling I would be accepted’ (39%) slightly higher than ‘not comfortable enough within myself’ (38%).
Women.Women of diverse sexuality and gender in engineering generally report similar experiences in comparable proportions as the overall population. For example, a large proportion (72%) say that their employee networks feel inclusive of women, and 80% of them agree that having visible out women as role models is important.
Gender Diverse. Engineering respondents with diverse gender identities were as likely as the overall population to report that their employer’s policies or work practices met or exceeded their expectations when asked about visibility of inclusion for gender diverse employees (63%), and alternatives to gendered dress codes (43%). However, gender neutral toilets presented an area where engineering respondents think their employees fell short. Only 31% of trans and gender diverse engineering respondents say that they have the freedom to use the toilets of choice at work, and 19% of them say there is availability of all-gender or gender-neutral toilets, compared with 42% and 28% respectively in the overall population.
Conclusion
It was pleasing to see that although fewer people in engineering identified as LGBTQ+, there are just as many people who support inclusion work as those in the overall population. Likewise, LGBTQ+ people in engineering report a much higher satisfaction with inclusion (visibility, promotion and experience) and executive level advocacy and support. However, like the overall population, a large proportion in engineering are passive allies. All of this points to a considerable number of non-LGBTQ identifying people in engineering who are passive allies and represents a group who are willing to be active allies if given the right understanding and education on the importance of allies and simple ways of being active to make allyship less daunting. Also, senior leaders have an essential role in cultivating a culture of allyship: first, by considering LGBTQ+ inclusion a core part of what differentiates their organisation from others; second, baking D&I principles into all aspects of business, and third, speaking publicly with their own ally stories.
Engineering employees are much less likely to be out in the workplace which is a cause of concern. While we cannot and should not force anyone out of the closet, we know that a quarter of respondents believe that being out will negatively impact their career or work experience, or face rejection in their workplace. Employers cannot afford to be too sanguine in this area – they are not easy issues to remedy. However, we have seen successful shifts in organisations where policies are inclusive, senior management is publicly supportive and workplace culture is positive for all employees. What is changing, we hope, is organisations’ growing awareness that workplace policies, executive leadership and employee resource groups are highly interrelated and that the biggest benefits over time accrue to organisations that balance efforts across all three.
The Australian Workplace Equality Index Employee Survey 2021: Insurance Industry Observations
written by Christopher Nelson, Senior Relationship Manager, Pride in Diversity | 2 July 2021
Response rate and respondents
There were 1,217 responses in 2021 from the Insurance industry and 303 people who identified as LGBTQ. The respondents from the Insurance industry are skewed to NSW (41%) and Victoria (23%) and are primarily metropolitan based at 91% which is significantly higher than of all respondents at 81%.
The Insurance industry has a lower population with Bachelor and higher degrees (55%) as compared to the overall at 63%.
GLBTQ inclusivity within the Insurance industry
More than 91% of Insurance respondents support the work that their organisation does for the inclusion of employees with diverse sexualities and genders. This is compared to 85% for all respondents. Likewise, 89% of Insurance respondents think that it is important that employers be active in the area of LGBTQ inclusion, compared to 83% for all sectors.
There is a positive difference regarding visible sign of an organisation’s support for LGBTQ inclusion. In the Insurance industry 84% of respondents acknowledge visible support compared to 78% for all respondents.
There is no significant difference between the Insurance industry and all the employee respondents regarding the tolerance and addressing of jokes and innuendos aimed at LGBTQ people.
When we come to active or passive allies, there also is little difference for the Insurance industry compared to all respondents. Both had a low result for active allies with only 22% stating that they were active allies in Insurance, compared to 20% for all respondents.
Knowledge of active allies in the respondent’s immediate work area was higher in the Insurance industry at 66% compared to 56% for all. Yet there is little difference for knowledge of executive allies in the workplace with 56% in Insurance against only 54% for all employers.
There was little difference in the Insurance industry on what might influence passive allies to become active allies. The higher scores were on how to be an active ally (41%) and more importantly on how to be an active ally when time is limited (43%).
When asked about whether their employer exceeded or met expectations concerning LGBTQ inclusive practices, the Insurance cohort on every statement had a significantly higher rating (5% to 10% and above) on expectations met or exceeded than the responses for all survey participants. These practices included:
Communication of inclusion initiatives for sexuality and gender diverse employees during the recruitment process (Insurance 61% vs All 53%)
My experience of inclusion within my immediate work area (Insurance 87% vs All 77%)
Communication of sexuality and gender diverse inclusion throughout the year (Insurance 80% vs All 68%)
Overall organisational commitment to people of diverse sexuality and/or gender (Insurance 86% vs All 76%)
The level of executive endorsement of sexuality and gender diverse inclusion initiatives (Insurance 71% vs All 67%)
Visibility and promotion of an internal employee network for sexuality & gender diverse employees and allies (Insurance 82% vs All 68%)
Visibility and promotion of inclusion or ally training regarding sexuality and gender diversity (Insurance 68% vs All 56%)
Willingness of managers to address negative commentary/jokes that target people of diverse sexuality and/or diverse gender (Insurance 78% vs All 66%)
Confidential avenues to safely report bullying/harassment related to one's diverse sexuality and/or diverse gender (Insurance 86% vs All 72%)
Visibility of active allies (Insurance 69% vs All 57%)
Similarly, the Insurance cohort rated the following statements significantly higher (mostly 10% higher) than their other industry cohort.
I would feel comfortable bringing my partner to work events here (Insurance 89% vs All 79%)
I would recommend this organisation as an inclusive place to work for people of the same, or similar, sexual orientation and/or gender diversity (Insurance 86% vs All 78%)
I don't hear jokes/innuendo targeting people of diverse sexuality here (Insurance 80% vs All 70%)
I don't hear jokes/innuendo targeting people of diverse genders here (Insurance 81% vs All 69%)
Any jokes/innuendo targeting people of diverse sexuality and/or gender are acted upon quickly here (Insurance 64% vs All 51%)
Active allies have positively impacted my sense of inclusion here (Insurance 58% vs All 49%)
While the Insurance industry appears more LGBTQ inclusive, the results for acting on jokes and innuendos are still quite low. As is the case of active ally impact on inclusion.
GLBTQ respondents
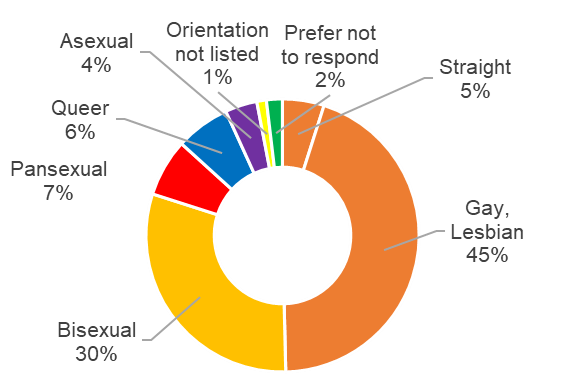
Moving on to sexual orientation, more Insurance respondents identified as Gay or Lesbian (65%) than for all survey respondents (55%). Identifying as any other diverse sexuality, the Insurance industry was lower than for all survey respondents.
On being out at work regarding their sexual orientation, the Insurance industry respondents were 10% higher in being out to all compared to 51% for all survey respondents, however, this is still quite low.
Being the target of unwanted jokes, innuendo and commentary and the target of serious bullying and sexual harassment is lower in the Insurance industry compared with all respondents. However, feeling safe and supported to report these incidents was significantly higher in the Insurance industry at 91% compared to 82% in other industries.
The reasons for not being out in the workplace had similar rates across the Insurance industry as with all survey respondents, although marginally higher:
I feel being out at work would be detrimental to my workplace experience
I feel being out at work would negatively impact my career progression
I do not feel I would be accepted by some members of my team
One reason for not being out was somewhat different in its responses. With the statement, ‘I am not comfortable enough within myself to be out at work’, 41% of the Insurance respondents agreed or strongly agreed, whereas for all survey respondents the score was 38%. Both scores are very concerning.
The survey responses of being a woman of diverse sexuality and/or gender in the Insurance industry are generally similar to those from the total survey responses, except for the inclusivity of LGBTQ employee networks. Women of diverse sexuality and/or gender in the Insurance industry believe that their employee networks are more inclusive than the norm (76% vs 68%).
The Insurance industry rates higher than the norm on the visibility of inclusion of gender diverse people (74% vs 58%). However, well communicated policies for affirming gender in the workplace were only marginally better than the norm (51% vs 48%). The experiences of being gender diverse or having a trans experience are roughly similar to the norm.
Conclusions
The survey results are positive for the Insurance industry compared to the survey results from all respondents. Like other industries, the Insurance industry needs to do more work promoting the need for active allies in the workplace, particularly executive allies. Although employees of diverse sexuality are more comfortable being out to all, at 51% there is still work to do so that LGBTQ employees can bring their whole selves to work.
The Australian Workplace Equality Index National Engagement Survey 2021: Pharmaceutical Industry Observations
written by Nicki Elkin, Senior Relationship Manager, Content Specialist Co-convenor Sapphire Programme, Pride in Diversity | 1 July 2021
The 2021 engagement survey saw a similar number of participants from the Pharmaceutical industry as 2020, with 330 survey respondents from organisations working in this area (approximately 50% also participated in the survey in 2020). The analysis does not include those professionals employed in other industries or sectors. Of these, 32 participants identified as being part of the LGBTQ community (10.1% vs 18.8% of the national cohort).
In regard to the demographic segmentation of the survey participants, this industry differs from the national mix in a number of significant areas:
The industry is highly centralized into NSW (62% compared to 30% of the national cohort)
Has more representation of women (66% vs 54%) *
Has no respondents who self-identified as having a non-binary gender (vs 1.3%)
Has more employees with bachelor and post-graduate degrees (85% vs 64%) *
Over-represented by people working in city/metro areas (94.3% vs 81.1%) *
Over-represented by people in senior management positions (16.4% vs 7.5%) *
The industry also appears to be under-represented by Aboriginal and/or Torres Strait Islanders, people living with disabilities, neurodiverse people, and mature age employees, and over-represented by people of colour and people of faith/religion.
There were also some significant differences in the personal views of LGBTQ people within the industry. While the numbers of participants raised in an environment where same-sex relationships or gender diverse people were not easily accepted is similar (49.8% vs 48.7%), and as is the numbers of participants who believe romantic relationships between people of diverse sexuality and/or gender are just like any other (89.5% vs 87.9%), the number of participants who believe there are more than two genders is significantly higher (64.5% vs 54.6%).
When you look at the state of LGBTQ workplace inclusion, the survey indicates that the pharmaceutical industry is performing well compared to the national cohort. In nearly all the key questions within the survey, the participants indicate better performance than the national results.
Some of the most pronounced differences include:
95% of total respondents in the industry support the work their organisation does for the inclusion of employees of diverse sexuality and/or gender (vs 85% nationally)
91% think it is important that employers be active in this area of diversity & inclusion (vs 83%) and 92% believe this work has a positive influence on organisational culture (vs 82%)
71% of total respondents in the industry thought an organisation’s positive track record in this aspect of inclusion would positively influence them to join the organisation (vs 59% nationally)
93% thought that initiatives in this area have been regularly communicated during the year (vs 75%)
90% have heard their executive leaders speak positively about this aspect of diversity & inclusion (vs 71%)
80% stated that awareness or ally training was made available throughout the year (vs 59%) and 66% had attended such training (vs 35%)
71% claimed jokes and innuendo were called out and addressed (vs 58%)
Only 7% of total respondents have witnessed negative behaviours/mild harassment (vs 14%) and 2.5% have witnessed serious bullying (vs 5.3%) targeting LGBTQ people
Health and wellbeing indicators were higher than average:
90% of total respondents feel mentally well at work (vs 78%)
90% feel they can be themselves at work (vs 81%)
90% feel a sense of belonging (vs 77%)
Business case indicators were also more positive with 94% of participants feeling productive (vs 88%) and 93% feeling engaged (vs 81%).
In regard to active allies, the industry exceeds the national profile, despite there being fewer LGBTQ respondents (LGBTQ people are twice as likely to be an active ally than non-LGBTQ); 33% of respondents would describe themselves as active allies (vs 23%), and consequently allies are for more visible within this industry:
82% of total respondents know of active allies within their immediate work area (vs 56%)
82% know of active executive allies or Sponsor/s within their organisation (vs 54%)
For people who support LGBTQ inclusion, but are not active, the highest reason given is “too busy” (51% vs 42%). Fewer passive supporters are likely to be influenced with more information about why allies are important or how to be an ally, but the provision of information on being an active ally when time is limited is likely to be more influential in this industry (47% vs 43%). This is an important group of people, and potentially means many can be ‘activated’ with the provision of targeted education / resources.
The experiences of LGBTQ employees participating in the survey from the Pharmaceutical industry is significantly more positive than the national cohort across the board, with their employer organisations meeting or exceeding their expectations in multiple areas:
communication of LGBTQ inclusion initiatives during the recruitment process (67% vs 53%)
experience of inclusion within their immediate work area (93% vs 79%)
overall organisational commitment to people of diverse sexuality and/or gender (96% vs 76%)
level of executive endorsement of sexuality and gender diverse inclusion initiatives (93% vs 67%)
visibility and promotion of an internal employee network for LGBTQ employees and allies (96% vs 68%)
visibility and promotion of inclusion or ally training (96% vs 56%)
willingness of managers to address negative commentary/jokes that target LGBTQ people (85% vs 66%)
It is pleasing to see that, for the LGBTQ employees, visibility of active allies is far higher than the national cohort (93% vs 57%), and in turn, the visibility of active allies has positively impacted their sense of inclusion (86% vs 49%).
The seemingly more positive experiences appears to be reflected in the levels of employees with diverse sexualities within this cohort reporting being ‘out’ in their workplaces vs the national cohort; 79% report they are out to most or everyone they work with (vs 61%). It should be noted that 63% of LGBTQ participants are men, who are significantly more likely to be out in their workplace than women or non-binary people.
Those ‘out’ employees with diverse sexualities also report more positive experiences than the national cohort in a number of areas, such as feeling supported by their organisation coming out to suppliers, customers or external business contacts (100% vs 78%). The majority have not encountered any exclusion based on their sexuality within their organisation (89% vs 83%), and don’t believe their sexuality would have any impact on their career progression (95% vs 81%). They feel both their performance and overall engagement is positively impacted by being out (89% vs 66% and 89% vs 73% respectively).
Happily, those employees who are ‘out’ about their diverse sexuality in this industry report experiencing lower levels of negative behaviours than the national average; only 5% have been targeted with jokes, innuendo and commentary (vs 13%), and 5% have been the target of more serious bullying/sexual harassment targeting their sexuality (vs 6%).
One of the most significant variation from the national indicators was whether workplace inclusion initiatives for diversity of sexuality and gender have had a positive impact on how they felt about their sexuality. 95% agreed on this point, whereas nationally only 60% did.
In regard to not being ‘out’, the reasons why tend to be similar to the national cohort. The largest reason is “not comfortable within myself to be out at work”, which was cited as the reason by 60% of this industry (similar to the national cohort). 40% cite “I do not feel I would be accepted by some members of my team” as a reason for not being ‘out’ (vs 39%), and 20% cite “being out at work would be detrimental to my workplace experience” as a reason (vs 33%). 20% of respondents who are not out do believe that being out at work would negatively impact their career progression.
There are a couple of key areas where this sector is potentially lagging.
Firstly, LGBTQ women are under-represented within the survey, with only 38% of LGBTQ respondents being women (despite women being over-represented within the total survey participation). This means that, despite 80% of LGBTQ women reporting that having visible out women as role models of the same or similar identity is important to them, nationally the levels of women who do have these role models is low, and within the Pharmaceutical industry it is even lower, with only 30% reporting that there are women of similar, or the same, identity as them who are visible out role models within their workplace (vs 43%).
Secondly, only 5 respondents self-identified as having a diverse gender, which makes the number of responses too small to report on. However, we know that within the national level, inclusion of gender diverse people is not as advanced as inclusion of people with a diverse sexuality, as can be seen within the national cohort.
For example, only 34% of participants with a diverse gender found their organisation’s recruitment process to be inclusive of diverse gender applicants, and only 15% disclosed their gender diversity during the application process.
58% of gender diverse employees in this industry saw visibility of organisational inclusion for gender diverse employees, but some practical measures were not so positive; only 42% of respondents reported they had freedom to use toilets of choice, only 41% reported some alternatives to gendered dress codes or uniforms, and only 47% report their organisation acknowledges gender diversity beyond the binary of male/female.
In nearly all aspects of gender diversity inclusion, the performance of organisations is reported as a poor compared to inclusion of diverse sexualities. It should be noted that this set of questions was give to everyone who self-identified as having a diverse gender, however some participants selected N/A (e.g. they may have made no steps to affirm their gender in their workplace, or they may not be ‘out’ in their organisation). When these responses are excluded, 18% report that they have been deliberately misgendered, 15% of people being targeted with unwanted jokes, innuendo, commentary as a direct result of their gender diversity, and 10% being the target of more serious bullying/sexual harassment. This indicates that these negative behaviours are experienced at significantly higher levels than by people with diverse sexualities.
While there are fewer regionally/rurally based employees within this industry than the national average, those who are report higher levels of inclusion than the national cohort. For example, 76% report their organisation's diversity initiatives for the inclusion of people of diverse sexualities or genders have been adequately communicated within their site/office (vs 59%), 76% report being easily able to connect into head office activities for this area of diversity & inclusion (vs 46%), 71% report having a local person/champion to help drive sexuality and gender diversity inclusion initiatives (vs 35%).
In summary, the Pharmaceutical industry can be proud of their substantive work in this space. Their teams indicate, through the survey, that much progress has been made. The data confirms the journey is not done and a number of areas require specific and focused work, particularly in increasing visibility and participation of those people with under-represented genders.
The Australian Workplace Equality Index Employee Survey 2021: Banking and Finance Industry Observations
written by Christopher Nelson, Senior Relationship Manager, Pride in Diversity | 29 June 2021
Response rate and respondents
There was a drop in respondents from the Banking & Finance Industry, down from 4,354 responses in 2020 to 2,688 responses in 2021 (38% drop). There were 466 people who identified as LGBTQ, which was also a drop from 736 last year (36% drop).
The responders from the Banking & Finance industry are skewed to NSW (51%) and Victoria (31%) and are primarily metropolitan based at 94% which is significantly higher than of all respondents at 81%.
The Banking and Finance industry has a greater population with Bachelor and higher degrees (75%) as compared to the all at 63%.
GLBTQ inclusivity within Banking and Finance
More than 91% of Banking & Finance respondents support the work of their organisation does for the inclusion of employees with diverse sexualities and genders. This is compared to 85% for all respondents. Likewise, 89% of Banking & Finance respondents think that it is important that employers be active in the area of LGBTQ inclusion, compared to 83% for all sectors.
When looking at executive buy in with LGBTQ inclusion, 81% of Banking & Finance employees have heard a senior executive speak about LGBTQ inclusion, whereas only 71% of all industry employees have heard their leaders speak on LGBTQ inclusion. There is a similar positive difference regarding visible sign of an organisation’s support for LGBTQ inclusion (86% vs 78% for all).
There is no significant difference between the Banking & Finance industry and all the employee respondents on regarding the tolerance and addressing of jokes and innuendos aimed at LGBTQ people.
When we come to active or passive allies, there also is little difference for the Banking & Finance industry compared to all respondents. Both had a low result for active allies with only 20% stating that they were active allies. Knowledge of active allies in the respondent’s immediate work area was higher in the Banking & Finance industry at 65% compared to 56% for all. Similar numbers were reported for knowledge of executive allies in the workplace with 67% in Banking & Finance against only 54% for all employers.
Staying with the theme of allies, the Banking & Finance cohort had higher rates on becoming active allies with the right information, including the ‘why’ and the ‘how’ of being an ally. The percentage was significantly higher for information on how to become an active ally when time was limited (50% vs 43%). They were also lower in answering the statement that nothing would influence them to be an active ally (26% vs 32%).
When asked about whether their employer exceeded or met expectations concerning LGBTQ inclusive practices, the Banking & Finance cohort every statement had a significantly higher rating on expectations met or exceeded that the responses for all survey participants. These practices included:
Communication of inclusion initiatives for sexuality and gender diverse employees during the recruitment process
My experience of inclusion within my immediate work area
Communication of sexuality and gender diverse inclusion throughout the year
Overall organisational commitment to people of diverse sexuality and/or gender
The level of executive endorsement of sexuality and gender diverse inclusion initiatives
Visibility and promotion of an internal employee network for sexuality & gender diverse employees and allies
Visibility and promotion of inclusion or ally training regarding sexuality and gender diversity
Willingness of managers to address negative commentary/jokes that target people of diverse sexuality and/or diverse gender
Confidential avenues to safely report bullying/harassment related to one's diverse sexuality and/or diverse gender
Visibility of active Allies
Similarly, the Banking & Finance cohort rated the following statements significantly higher (from 5% to 10% higher) than their other industry cohort.
I would feel comfortable bringing my partner to work events here
I would recommend this organisation as an inclusive place to work for people of the same, or similar, sexual orientation and/or gender diversity
I don't hear jokes/innuendo targeting people of diverse sexuality here
I don't hear jokes/innuendo targeting people of diverse genders here
Any jokes/innuendo targeting people of diverse sexuality and/or gender are acted upon quickly here
Active Allies have positively impacted my sense of inclusion here
GLBTQ respondents
Moving on to sexual orientation, more Banking & Finance respondents identified as Gay or Lesbian (68%) than all respondents (55%). Identifying as any other diverse sexuality, the Banking & Finance industry was lower than for all respondents.
On being out at work regarding their sexual orientation, the Banking & Finance industry was almost 5% higher in being out to all at 45%.
While being the target of unwanted jokes, innuendo and commentary and the target of serious bullying and sexual harassment is largely consistent in both the Banking & Finance industry and with all respondents, feeling safe and supported to report these incidents was significantly higher in the Banking & Finance industry at 89% compared to 81% in other industries.
The reasons for not being out in the workplace had similar rates across the Banking & Finance industry as with all respondents:
I feel being out at work would be detrimental to my workplace experience
I feel being out at work would negatively impact my career progression
I do not feel I would be accepted by some members of my team
One reason for not being out was quite different in its positive responses. With the statement, ‘I am not comfortable enough within myself to be out at work’, 33% of the Banking & Finance respondents agreed or strongly agreed, whereas for all respondents the score was 38%.
Women of diverse sexuality and/or gender generally have more positive experiences in the current workplace in the Banking & Finance industry than across the broader respondents. An example would be the inclusivity of employee networks. In the Banking & Finance industry, 73% agree or strongly agree as compared to 68% across the board.
Expectations of employers regarding gender identity or trans experience were consistent across Banking & Finance and all respondents, mostly below 50% on met or exceeds, which is disappointing and requires far more action. Where the Banking & Finance industry does better than with all respondents was regarding being the target of joke, innuendo and more serious bullying and sexual harassment, with the Banking & Finance industry experiencing mostly 5% fewer reports.
Conclusions
More work needs to be done to turn passive allies into active ones, which means more education on why allies are important and how people can be active allies while having busy jobs. Senior leaders have an important role in this by speaking publicly with their own ally stories.
Although the Banking & Finance industry rates higher than the average on being out at work, if you are sexually diverse, the fact that more young and new employees feel unable to be themselves in the workplace requires greater visibility of LGBTQ inclusion at job advertisement, recruitment and induction stages.
The Banking & Finance industry rates higher or equal positive on most themes covered by the AWEI Employee Survey than the general employee population which may be attributable to the longevity the longevity of their LGBTQ inclusion strategies and networks but also must be attributed to their continued passion, drive and network sustainability. This is quite remarkable given their difficulties with a royal commission and federal regulators that have rocked other aspects of their workplace cultures and reputations in the past several years.
The Australian Workplace Equality Index National Engagement Survey 2021: Property/Construction/Build Industry Observations
written by Nicki Elkin, Senior Relationship Manager, Content Specialist Co-convenor Sapphire Programme, Pride in Diversity | 23 June 2021
The 2021 engagement survey saw a significant increase in participants from the Construction/Property/Built Environment sectors, with over 2,800 survey respondents from organisations with the sector. (The analysis does not include those professionals employed in other sectors). Of these, 337 participants identified as being part of the LGBTQ community (12.6% vs 18.8% of the national cohort).
In regard to the demographic segmentation of the survey participants, this sector differs from the national mix in a number of significant areas:
The sector is more centralized into NSW and QLD (60% compared to 51% of the national cohort)
Has more representation of men (49% vs 43%), and less of women and non-binary people (49% vs 54% and 0.6% vs 1.3% respectively) ¥
Has more employees with bachelor and post-graduate degrees (76% vs 64%) *
Over-represented by people working in city/metro areas (91.4% vs 81.1%) *
Over-represented by people in senior management positions (11.3% vs 7.5%) *
The sector also appears to be under-represented by Aboriginal and/or Torres Strait Islanders, people who have a CALD background, people living with disabilities, neurodiverse people, and mature age employees.
One area we were keen to investigate was the experience of ‘site-based’ employees across different sectors (as opposed to those based in ‘Head Office’ or regional offices), which is of particular interest to construction sector organisations. Unfortunately, there were very few survey respondents who answered this question; either the question was unclear or very few site-based employees participated in the survey.
When you look at the state of LGBTQ workplace inclusion, the survey indicates that the property, construction and built environment sector is performing well compared to the national cohort. In nearly all the key questions within the survey, the sector records better performance than the national results.
Some of the most pronounced differences include:
89% of respondents in the sector support the work their organisation does for the inclusion of employees of diverse sexuality and/or gender (vs 85% nationally)
64% of respondents in the sector thought an organisation’s positive track record in this aspect of inclusion would positively influence them to join the organisation (vs 59% nationally)
83% thought that initiatives in this area have been regularly communicated during the year (vs 75%)
82% have heard their executive leaders speak positively about this aspect of diversity & inclusion (vs 71%)
67% stated that awareness or ally training was made available throughout the year (vs 59%) and 41% had attended such training (vs 35%)
63% claimed jokes and innuendo were called out and addressed (vs 58%)
11% of people have witnessed of negative behaviours/mild harassment (vs 14%) and 3.5% have witnessed serious bullying (vs 5.3%)
Health and wellbeing indicators were higher than average:
83% of respondents feel mentally well at work (vs 78%)
88% feel they can be themselves at work (vs 81%)
82% feel a sense of belonging (vs 77%)
Business case indicators were also more positive with 92% of participants feeling productive (vs 88%) and 86% feeling engaged (vs 81%).
In regard to active allies, the sector matches the national profile, despite there being fewer LGBTQ respondents (LGBTQ people are twice as likely to be an active ally than non-LGBTQ); 27% of respondents would describe themselves as active allies, however they are possibly more visible within the property sector. This is reflected in the visibility of allies:
60% of respondents know of active Allies within their immediate work area (vs 56%)
62% of respondents know of active executive Allies or Sponsor/s within their organisation (vs 54%)
For people who support LGBTQ inclusion, but are not active, the highest reason given is ‘too busy’ (42%, matching the national cohort), but the provision of information on being an active ally when time is limited is likely to be far more influential in this sector (48% vs 43%). This is an important group of people, and potentially means many can be ‘activated’ with the provision of targeted education / resources.
The experiences of LGBTQ employees participating in the survey from the property, construction and built environment sector is more positive than the national cohort across the board, with their employer organisations meeting or exceeding their expectations in multiple areas:
communication of LGBTQ inclusion initiatives during the recruitment process (63% vs 53%)
experience of inclusion within their immediate work area (85% vs 79%)
overall organisational commitment to people of diverse sexuality and/or gender (85% vs 76%)
level of executive endorsement of sexuality and gender diverse inclusion initiatives (76% vs 67%)
visibility and promotion of an internal employee network for LGBTQ employees and allies (75% vs 68%)
visibility and promotion of inclusion or ally training (66% vs 56%)
willingness of managers to address negative commentary/jokes that target LGBTQ people (74% vs 66%)
It is pleasing to see that, for the LGBTQ employees, visibility of active allies is higher than the national cohort (63% vs 57%), and in turn, the visibility of active allies has positively impacted their sense of inclusion (58% vs 49%).
However, despite the seemingly more positive experiences, LGBTQ employees within this cohort report lower levels of being ‘out’ in their workplaces than the national cohort. For people with diverse sexualities, only 54% report they are out to most or everyone they work with (vs 61%), and for people with diverse genders, 30% report that most people they work with are aware of their gender diversity (vs 28%). It is also worth noting that this number has declined year on year for LGBTQ participants, across the board.
Those ‘out’ employees with diverse sexualities also report more positive experiences than the national cohort in a number of areas, such as feeling supported by their organisation coming out to suppliers, customers or external business contacts (84% vs 78%). The majority have not encountered any exclusion based on their sexuality within their organisation (90% vs 83%), and don’t believe their sexuality would have any impact on their career progression (84% vs 81%). They feel both their performance and overall engagement is positively impacted by being out (74% vs 66% and 81% vs 73% respectively).
Happily, those employees who are ‘out’ about their diverse sexuality in this sector report experiencing lower levels of negative behaviours than the national average; only 7% have been targeted with jokes, innuendo and commentary (vs 13%), and 5% have been the target of more serious bullying/sexual harassment targeting their sexuality (vs 6%).
One of the most significant variation from the national indicators was whether workplace inclusion initiatives (for diversity of sexuality and gender) have had a positive impact on how they felt about their sexuality. 75% agreed on this point, whereas nationally only 60% did.
In regard to not being ‘out’, the reasons why tend to be similar to the national cohort. The largest reason is “not comfortable within myself to be out at work”, which was cited as the reason by 39% of this sector (similar to the national cohort). 31% cite “I do not feel I would be accepted by some members of my team” as a reason for not being ‘out’ (vs 39%), and 25% cite “being out at work would be detrimental to my workplace experience” as a reason (vs 33%). 24% of respondents who are not out do believe that feel being out at work would negatively impact their career progression.
For LGBTQ women, similar to the national cohort, 78% report that having visible out women as role models of the same or similar identity is important to them, however nationally the levels of women who do have these role models is low, and within the property, construction and build environment sector it is even lower. Only 42% report that there are women of similar, or the same, identity as them who are visible out role models within their workplace (vs 43%), only 25% see them within senior leadership or executive positions (vs 29%), and only 43% report seeing other LGBTQ women active within their employee network (vs 50%).
On gender diverse recruiting, the data indicates this sector has not progressed well. This is not done particularly well at a national level, and property and construction is lagging; only 25% of participants with a diverse gender found the recruitment process to be inclusive of diverse gender applicants (vs 34%). Having said that, 19% disclosed their gender diversity during the application process (vs 15%), and only 4% felt disadvantaged during the recruitment process (vs 6%)
63% of gender diverse employees in this sector saw visibility of organisational inclusion for gender diverse employees (vs 58%), but some practical measures were not so positive; only 31% of respondents reported they had freedom to use toilets of choice (vs 42%), 39% reported some alternatives to gendered dress codes or uniforms (vs 41%), and only 43% report their organisation acknowledges gender diversity beyond the binary of male/female (vs 47%).
In nearly all aspects of gender diversity inclusion, the performance of organisations is reported as a poor compared to inclusion of diverse sexualities. This includes 6% of people being deliberately misgendered, 12% of people being targeted with unwanted jokes, innuendo, commentary as a direct result of their gender diversity, and 8% being the target of more serious bullying/sexual harassment ( vs 8%, 8% and 6% respectively).
It should be noted that this set of questions was give to everyone who self-identified as having a diverse gender, however some participants selected N/A (e.g. they may have made no steps to affirm their gender in their workplace, or they may not be ‘out’ in their organisation). If these respondents are excluded the data is quite different; 18% report that they have been deliberately misgendered (in line with national cohort), 23% of people being targeted with unwanted jokes, innuendo, commentary as a direct result of their gender diversity (vs 15%), and 15% being the target of more serious bullying/sexual harassment (vs 10%). This indicates that these negative behaviours are experienced at significantly higher levels than by people with diverse sexualities, and this sector performs worse than the national average.
However, there are some positives, too:
55% can freely use gendered toilets of choice without opposition (vs 49%)
63% report people make an effort to use their personal pronouns (vs 58%)
79% have not experienced any exclusion based on their gender diversity (vs 66%)
73% report their gender identity has not had any impact on their career progression (vs 64%)
69% say workplace Inclusion initiatives for diversity of sexuality and gender have had a positive impact on how they feel about their own gender diversity (vs 56%)
These are still lower than for people with diverse sexualities, which indicates that inclusion of people with diverse genders should be an area of future focus for all organisations, including those in property, construction and built environment sector.
While there are fewer regionally/rurally based employees within this sector than the national average, those who are report higher levels of inclusion than the national cohort. For example, 63% report their organisation's diversity initiatives for the inclusion of people of diverse sexualities or genders have been adequately communicated within their site/office (vs 59%), 60% report being easily able to connect into head office activities for this area of diversity & inclusion (vs 46%), 41% report having a local person/champion to help drive sexuality and gender diversity inclusion initiatives (vs 35%).
In summary, the Property, Construction and Built environment sector can be proud of their substantive work in this space. Their teams indicate through the survey, that much progress has been made. The data confirms the journey is not done and a number of areas are requiring specific and focused work (confirmed by AWEI benchmark results in participating firms).
The Australian Workplace Equality Index National Engagement Survey 2021: Technology Industry Observations
written by Mark Latchford, Associate Director, Pride in Diversity | 15 June 2021
The 2021 engagement survey saw a significant increase in participants from the Technology sector, with over 2,800 survey respondents from organisations with the sector. (The analysis does not include those technology professionals employed in other sectors). Of these, 326 participants identified as being part of the LGBTQ community.
In regard to the demographic segmentation, the sector differs from the national mix in a number of significant areas:
The sector is more centralized into NSW (54% compared to 30% of the national cohort)
Has more employees with bachelor degrees (44% vs 32%)
Has more men than women (55% vs 43% whereas the national mix is 43% 54%)
The sector also appears to be under-represented by Aboriginal and/or Torres Strait Islanders, people living with disabilities and mature age employees. It has a higher representation of people of colour and those who have a CALD background.
When you look at the state of LGBTQ workplace inclusion, the survey indicators that the technology sector is performing better than most. In nearly all the key questions within the survey, the sector records better performance than the national results.
Some of the most pronounced differences include:
70% of respondents in the sector thought an organisation positive track record in this aspect of inclusion would positively influence me to join the organisation. (59% nationally)
86% thought that Initiatives in this sea have been regularly communicated during the year (n: 75%)
74% stated that awareness or ally training was made available throughout the year (n:59%) and 54% had attended such training (n:35%)
69% claimed jokes and innuendo were called out and addressed (n:57%)
10% witnessed of negative behaviours/mild harassment which was 14% nationally.
Business case indicators were also more positive with 90% of the professionals feeling productive at work (n:88%) and 86% feel engaged (n:81%). Health and wellbeing indicators are also higher than average.
In regard to Allies, the sector matches the national profile, except when asked why not an active ally, being too busy is cited 50% of the time (versus 42% by the national cohort)
Communication about inclusion as it relates to sexuality and gender diverse employees is markedly better in the technology sector, across all areas but especially in the recruitment process (72% vs 53%)
Executive endorsement is also significantly better (86% vs 67%) as is network promotion (86% vs 68%), training promotion (75% to 57%). It is particularly pleasing to see 81% felt managers would address negative commentary and jokes (n: 66%) and active allies are visible to 75% of the cohort (n: 57%)
Willingness to recommend the organisation and absence of inappropriate jokes/innuendo is also significant better that national data. 67% felt that active allies had had a positive impact (n:49%)
In regard to the LGBTQ cohort of respondents, 45% being out to everyone was higher than the national 40%, which may reflect the communication vehicles used within the industry.
The sector is also strong in supporting employees coming out to external stakeholders (such as clients). 92% felt support (n: 78%). Sexuality was not having an impact on their career progression 92% vs 81%).
Only 7% had been the target of unwanted jokes and innuendo which is nearly half the national rate of 13%. Being the target of more serious bullying and sexual harassment was again half the national rate 3% as opposed to 6%.
One of the most significant variation from the national indicators was whether workplace inclusion initiatives (for diversity of sexuality and gender) have had a positive impact on how they felt about their sexuality. 84% agreed on this point, whereas nationally only 60% did.
In regard to not being out, the overall percentage is lower as mentioned. The reasons why tend to be similar but lower than the national data except for “not comfortable within myself to be out at work”. That was cited as the reason by 44% of this sector, but only 37% nationally.
On the question relating to women, the numbers again tended to be significantly better except for one: “Women of similar identity as me are out within senior leadership” , 32% agreed with that versus 39% nationally.
On gender diverse recruiting, the data indicates this sector has progressed well. For example, 49% of respondents found the recruitment process inclusive for diverse gender applicants (n:34%)
Moreover, freedom to use toilets of choice (58% vs n:42%) and availability of all gender toilets (36% vs 28%) was more positive in this sector. Acknowledgement of gender diversity beyond the binary was at 70% (as opposed to 47% nationally. Folk making an effort to use personal pronouns was relatively high (42% vs n: 27%) and being misgendered was below the national average. In nearly all other aspects of gender diversity inclusion, the sector is positively well ahead (double digit differences) from the general national experiences. This includes 2% being the target of serious bullying and harassment for their gender diversity (nationally it is 6%). However, 8% of this sector (and the national cohort) had been the targets of unwanted jokes, innuendo and commentary.
As previously mentioned, in regard to intersectionality, the sector appears to have achieved results where colour/CALD and neurodiversity intersect with the LGBTQ community, but more work is needed with those of Aboriginal and Torres Strait Islander heritage or those of a mature age.
In summary, the Technology Sector can be proud of their substantive work in this space. Their teams indicate through the survey, that much progress has been made. The data confirms the journey is not done and a number of areas are requiring specific and focused work (confirmed by benchmark results in participating technology firms).
You, Me, and Them: Understanding Employees’ Use of Trans-Affirming Language within the Workplace
As the benefits of workplace inclusion become progressively recognized, employers are making greater efforts to cultivate inclusive organizational environments where employees from diverse backgrounds can thrive. Yet academic research has often neglected issues of sexual orientation and gender diversity. We contribute to redressing this knowledge gap by examining processes of workplace inclusion for employees with diverse genders and sexualities, focusing on an under-researched area—the role of language.
Methods
Using a regression framework, we empirically examine how different individual and workplace factors are associated with employees’ inclusive language use toward their trans- and gender-diverse colleagues. To accomplish this, we undertook the first-ever analyses of unique survey data from the 2020 Australian Workplace Equality Index Employee Survey (n ~ 27,000 employees and ~ 150 employers).
Results
Our results highlight the role of employees’ socio-demographic characteristics (e.g., their gender and sexual orientation, age, education, and religiosity) as well as the role of features of the workplace environment (e.g., employer’s size, location, and inclusion culture).
Conclusions
While use of appropriate language toward individuals with diverse genders and sexualities constitutes an important stepping stone to their workplace inclusion, this study has demonstrated that its adoption remains incomplete and highly segmented.
Social Policy Implications
These findings bear important implications for the design, targeting, and implementation of programs aimed at fostering trans-affirming language and the workplace inclusion of individuals from sexual and gender minorities.
Introduction
The benefits of workplace diversity and, particularly, workplace inclusion are progressively recognized by academics and employers alike (Mor Barak, 2015). As a result, employers across sectors are making greater and more concerted efforts to cultivate inclusive organizational environments where employees from both majority and minority social groups thrive (Ferdman, 2014). Academic research is well-placed to guide these efforts; for example, by empirically elucidating the individual- and structural-level factors that foster or inhibit processes of workplace inclusion. However, the bulk of the existing scholarship on diversity and inclusion has focused on socio-demographic traits such as age, gender, and ethnicity (Jackson et al., 2003), whereas other important personal qualities—such as sexual orientation and gender diversity—remain relatively under-researched (Day & Greene, 2008).
In this paper, we contribute to filling this gap in scholarly knowledge by providing a better understanding of the factors that contribute to the workplace inclusion of employees with diverse genders and sexualities. This is an important endeavor, as individuals from both sexual minorities (e.g., those who identify as gay, lesbian, bisexual, pansexual, asexual, etc.) and gender minorities (e.g., those who identify as trans, binary or non-binary) experience comparatively poor labor-market outcomes (Badgett et al., 2007). Further, their suboptimal outcomes in the realm of work compound with their generally higher levels of social disadvantage in other life domains, including education (Birkett et al., 2014), health and wellbeing (Institute of Medicine, 2011), and family life (Reczek, 2020). Previous scholarship on workplace inclusion among members of these social groups has concentrated on discrimination throughout the employment process (e.g., hiring, promotions, and termination) (Drydakis, 2019) as well as harassment and bullying within the workplace (Collins et al., 2015). Here, we focus on an aspect that has received comparatively little attention—the role of language within the workplace.
As we elaborate on below, language can serve as a powerful tool for both inclusion and exclusion, in the workplace and elsewhere (Diversity Council Australia, 2016). Language constitutes a core component of most of our everyday written and verbal interactions (Collins & Clément, 2012), and conventions about what constitutes appropriate language in the public sphere are in constant flux. In recent years, there have been substantial changes in language-related expectations in relation to individuals from some sexual and gender minorities. This applies for example to trans men and women, who may legally or socially change their name and/or align their personal pronouns to affirm their gender (Zimman, 2017). It pertains also to a growing number of people who identify as gender diverse and who often utilize gender-neutral personal pronouns that differ from those assigned at birth (e.g., “they/them” pronouns). Research studies have demonstrated that being addressed by the correct name and personal pronouns has important positive repercussions for the mental health and feelings of workplace inclusion of trans and gender-diverse employees (Budge et al., 2010; Thoroughgood et al., 2020). However, there is also emerging evidence indicating that many employees remain unwilling, hesitant, or uncomfortable to change the language that they use to refer to their trans and gender-diverse colleagues (Grant et al., 2011). Which employees are comfortable with changing their language to make these colleagues feel included, and which are not, remains an open question.
In the remainder of this paper, we theorize and subsequently test the individual and workplace factors that are associated with employees’ use of inclusive language toward their trans and gender-diverse colleagues. Enhancing our knowledge on these factors is timely and important, as it can meaningfully contribute to the design and implementation of programs and policies to foment the workplace inclusion of individuals with diverse genders and sexualities. As explained below, a feature that distinguishes our research from earlier efforts to interrogate processes of workplace inclusion among gender and sexual minorities is our reliance on quantitative methods. Specifically, we are able to undertake first-time academic analyses of an internationally unique survey that collects rich information on workplace inclusion from a large sample of Australian employees from multiple employers and sectors (the 2020 Australian Workplace Equality Index Employee Survey, n ~ 27,000 employees and ~ 150 employers). These unique data enabled us to provide a rare overview of the individual and organizational factors that act as enablers of, or barriers to, trans-affirming language use within the workplace.
While we recognize that some individuals may identify as “gender non-conforming,” “gender non-binary,” or “gender diverse” rather than explicitly as “trans,” for parsimony; hereon, we use the umbrella term trans as a shorthand to refer to individuals whose gender identity differs from the sex they were assigned at birth. Where specificity is required, we use the qualifier “binary” to refer to trans people who identify as men or women, and the qualifier “non-binary” to refer to trans people who do not.
Literature Review
Diversity and Inclusion in the Workplace
The term diversity refers to “differences between individuals on any attributes that may lead to the perception that another person is different from the self” (Roberge & van Dick, 2010, p.296). This includes perceived differences based on readily observable traits (e.g., age, sex, and race/ethnicity) and less easy-to-observe attributes (e.g., religion or sexual orientation) (Mor Barak, 2015; Roberge & van Dick, 2010). Achieving a diverse workforce means that members of different groups across these social divisions are adequately represented within the organization.
The benefits of workplace diversity are increasingly recognized and supported by a robust body of research. Diversity can provide organizations with a competitive advantage in recruitment, customer service, and research and innovation (Cox, 1994; Mor Barak et al., 2016) and has been empirically linked to improvements in employee job satisfaction (Acquavita et al., 2009), creativity and problem-solving skills (Richard et al., 2013), and commitment and retention (Giffords, 2009; Groeneveld, 2011). Furthermore, having a diverse workforce can be seen as exercising social responsibility, as it contributes to empowering marginalized social groups (Mor Barak, 2015; Mor Barak et al., 2016), while also enhancing corporate image (Cox, 1994). However, diversity is not universally associated with positive outcomes, with some studies reporting links to intergroup conflict, workplace dissatisfaction, and decreased cooperation (Jackson et al., 2003; Mor Barak et al., 2016; Roberge & van Dick, 2010).
These contradictory findings have been reconciled by recognizing the role of inclusion as a moderator of the relationship between workplace diversity and organizational outcomes (Nishii, 2013). Simply put, the benefits of workplace diversity cannot be realized without workplace inclusion (Ferdman, 2014). Here, inclusion refers to the degree to which employees perceive themselves as being a valued member of the organization, something that occurs when their needs for belongingness and uniqueness are satisfied (Mor Barak, 2015; Shore et al., 2011). Employee’s needs are significantly influenced by behaviors, policies, and practices operating at different levels of the organizational structure—including intra-personal, inter-personal, and organization-level factors (Ferdman, 2014; Mor Barak, 2015). Given its significance for individual and organizational outcomes, understanding the factors fostering workplace inclusion is an important endeavor.
Workplace Experiences of Trans Employees
Diversity and inclusion research has traditionally focused on socio-demographic traits such as age, sex, and ethnicity/race (Jackson et al., 2003). More recently, there have been timid attempts to examine workplace inclusion in relation to sexual orientation and gender identity (Day & Greene, 2008). Despite this, studies on sexual and gender minorities have tended to lump these groups together and/or prioritize sexual orientation, particularly the experiences of gay and lesbian employees (Beauregard et al., 2018). Workplace inclusion amongst trans employees, defined as individuals whose gender identity or expression diverges from their sex assigned at birth, remains poorly understood (Patev et al., 2019). Because trans employees are numerically under-represented and have little voice in the workplace (Beauregard et al., 2018), they are considered a “blind spot” for many organizations (Ozturk & Tatli, 2016, p.782).
Sexual orientation and gender identity are overlapping yet distinct constructs. While trans employees share their minority status with lesbian, gay, and bisexual (LGB) employees, they also face unique challenges that make their workplace experiences distinctive. Trans individuals may be more visually distinct (Grant et al., 2010) and thus more easily identifiable than LGB employees, and hence more likely to be perceived and/or treated as “different” or as “outsiders.” Further, public support for trans individuals and anti-discrimination laws protecting this group are lower than the analogous support and laws toward LGB people (Lewis et al. 2017). As a result, trans employees are more frequent targets of discrimination and bullying in the workplace than individuals with minority sexual orientations (Sawyer et al., 2016). Because trans people are typically a smaller workplace minority than LGB people, their ability to seek and receive support from other in-group members is more limited. In addition, the process of gender transitioning (or gender affirmation), whereby an individual aligns their gender presentation to their gender identity, also poses unique challenges for trans employees (Ozturk & Tatli, 2016). This process can be highly stressful for trans people, who often meet skepticism or resistance from co-workers and supervisors, and who may require psychological and even medical support (Ozturk & Tatli, 2016; Pepper & Lorah, 2008).
McFadden (2015) distinguishes between two types of discrimination: formal discrimination (prejudices manifesting in formalized contexts, such as in job hiring, performance evaluation, or employment termination) and informal discrimination (interpersonal incidents, such as being bullied, ostracized, or harassed). Research on trans employees has largely focused on the former, documenting that these employees are substantially less likely to find employment (Badgett et al., 2007) and get promoted (Grant et al., 2011) and much more likely to quit—or be fired from—their jobs (Budge et al., 2010; Dietert & Dentice, 2009; Grant et al., 2011). Nonetheless, in-depth interviews with trans employees also reveal the high extent of interpersonal discrimination that they experience. These experiences range from outright physical threats and verbal harassment (Budge et al., 2010; Nadal et al., 2012) to more subtle stressors, such as being the target of malicious gossip, transphobic jokes and remarks, or being ostracized by colleagues (Collins et al., 2015; Dietert & Dentice, 2009).
Fostering Trans-Inclusive Workplaces: The Role of Language
While language is often invoked in the context of discrimination, it can also serve as a powerful tool for the workplace inclusion of trans employees (Collins & Clément, 2012; Diversity Council Australia, 2016; Sawyer et al., 2016). Central to this is the correct use of pronouns to refer to trans employees, binary and non-binary (Zimman, 2017). Although not all trans individuals use pronouns that differ from those corresponding to their sex at birth, many of them choose to do so. For instance, 84% of the 27,700 respondents in the US Transgender Survey reported using a different set of pronouns than those assigned at birth to refer to themselves (James et al., 2016). The most commonly used pronouns amongst trans individuals (binary and non-binary) were “he/his” (37%), “she/her” (37%), and “they/their” (29%). A smaller share used the pronouns “ze/hir” (2%) or others not identified in the survey (4%). Importantly, pronouns are highly personal. For instance, not all trans non-binary individuals choose to use “they,” and others may use more than one set of pronouns or no pronouns at all (only first names) (National LGBT Health Alliance, 2013).
One type of language-related discrimination that is specifically targeted towards trans employees is misgendering. Misgendering refers to “the use of gendered language that does not match how people identify themselves, such as when people who identify as women are described as men” (Ansara & Hegarty, 2014, p.260). It often involves the use of personal pronouns that do not align with how a trans individual identifies—a practice known as mispronouning (Ansara & Hegarty, 2014). One example is when a trans woman using the pronoun “she” is addressed by others as “he,” either intentionally or unintentionally (Nadal et al., 2012). Mispronouning is a common experience amongst trans employees. Of the nearly 6500 respondents in the 2008 National Transgender Discrimination Survey in the USA, 26% of trans non-binary respondents and 51% of trans binary respondents reported having been mispronouned “repeatedly and on purpose” at work (Grant et al., 2011, p.62). These findings are consistent with those from a recent general-population online survey conducted in the USA, UK, Canada, and Australia, where between 12% (UK) and 22% (USA) of respondents admitted using incorrect pronouns when addressing trans binary people (Ipsos, 2018).
Qualitative studies focusing on the workplace experiences of trans individuals show that incorrect pronoun use not only creates stress, but also leads to feelings of rejection and invalidation (Budge et al., 2010; Kelly et al., 2020). The few studies exploring the impacts of appropriate pronoun use on trans employees have demonstrated that they help cultivate feelings of inclusion (Hanssmann et al., 2008). Based on interviews with trans employees, Budge and colleagues (2010) concluded that the use of correct pronouns was interpreted by trans individuals as a sign of workplace acceptance. Similarly, Thoroughgood et al. (2020) argued that trans employees attached great importance to simple acts of promoting proper pronoun usage by their co-workers. Taken together, these findings suggest that inclusive language plays a critical role in shaping the workplace experiences of individual trans employees. Critically, cumulative experiences of this type of discrimination may accrue, resulting in profound, detrimental effects on the long-term work careers of trans people (see, e.g., Ozturk & Tatli, 2018).
Given the importance of inclusive workplace language for the wellbeing of trans individuals and the fact that its use is not uniform, it is important to gain a clearer understanding of the individual- and organizational-level factors that promote and/or inhibit this. In the remainder of the paper, we develop and test different hypotheses about these factors, which constitute our key contribution to the scholarly literature.
Theorizing the Predictors of Trans-Affirming Language Use
In theorizing potential predictors of inclusive and non-inclusive language use toward trans individuals in the workplace, we adhere to several principles. First, we follow socio-ecological models of workplace relations by recognizing that these predictors may manifest at different levels of the organizational structure (Ferdman, 2014; Mor Barak, 2015). For instance, they may relate to the characteristics of individual employees (e.g., their age or gender), but also to broader workplace conditions (e.g., location or organizational culture). Second, we theorize inclusive and non-inclusive language use as being underpinned by three broad sets of factors: cognitive factors (e.g., awareness of inclusion issues or about the appropriate way to address trans individuals), language factors (e.g., level of English-language proficiency and ability to incorporate new language into one’s lexicon), and attitudinal factors (e.g., degree of support for workplace diversity and/or trans people). Third, we focus on individual and organizational traits that are measurable in the data at hand, thereby deriving theoretical propositions that we are able to test empirically.
A first set of factors that may influence an employee’s use of inclusive language use towards trans colleagues pertains to the employee’s gender identity and sexual orientation. Cisgender heterosexual women as well as individuals from gender and sexual minorities hold more supportive views about sexual and gender diversity than cisgender heterosexual men (Flores, 2015; Grollman, 2017; Perales & Campbell, 2018). For women, the difference is often attributed to a higher capacity for empathy and a stronger sense of solidarity with disadvantaged groups due to their own experiences of discrimination and oppression (Perales & Campbell, 2018). For individuals from diverse genders and sexualities, explanations often emphasize their higher investment in fostering inclusive workplace practices. These employees have an enhanced awareness of the value of inclusion and of what constitutes inclusive language and experience more direct personal gains through inclusion (Badgett et al., 2013). For these reasons, we hypothesize that the degree of comfort using trans-affirming language will be greater among female, gender-minority, and LGB employees than that of cisgender, heterosexual men (Hypothesis 1). However, there may also be disparities in the degree of comfort using trans-affirming language across members of different sexual-minority groups. For example, evidence shows that some gay men are highly supportive of cis-normative standards, penalizing gay men who behave or dress in gender non-conforming ways (see, e.g., Ozturk et al., 2020). For this reason, we compare the degree of comfort using trans-affirming language across finely defined sexual- and gender-minority groups.
In addition to gender and sexual expression, we expect other socio-demographic characteristics of employees to be associated with inclusive and non-inclusive language use toward trans individuals in the workplace. Concerning age, we expect younger individuals to be more comfortable using inclusive language than older individuals. This responds to evidence of more progressive attitudes toward sexual and gender minorities among individuals born in more recent cohorts (Flores, 2015; Smith et al., 2014), coupled with greater cognitive barriers to expanding one’s lexicon associated with ageing (Wright, 2016). We also expect education to be positively related to the use of inclusive language, given its association with increased verbal ability and greater support for civil liberties (Ohlander et al., 2005; Perales, 2018). In contrast, religiosity is likely to have a negative effect on inclusive language use, given widespread disapproval of same-sex behavior and support for traditional gender roles across individuals from different religious denominations (Perales et al., 2019). Finally, individuals from a culturally and linguistically diverse (CALD) background—defined here as Australian residents coming from countries whose main language is not English—may be less likely to use inclusive language. This responds to both evidence of more conservative attitudes toward gender and sexuality in many non-Western cultures (Kite et al., 2019) and possible difficulties in incorporating new terms and complex pronouns in a non-native language. Altogether, we expect that the degree of comfort using trans-affirming language will be greater among younger, more educated, non-religious, and native English-speaking employees (Hypothesis 2). We formulate no explicit prediction for employees being of Aboriginal or Torres Strait Islander (i.e., Indigenous) descent. However, given the significance of this demographic indicator in the Australian context, we include a relevant variable as a model covariate to explore its independent influence.
As noted earlier, broader factors at the organizational or workplace level may also influence the use of trans-inclusive language. Levels of structural stigma against sexual and gender minorities vary across different workplaces and/or organizations based on their physical or sectoral location. For example, stigma may be greater in less urbanized areas (Valfort, 2017) and in more male-dominated industries and/or sectors of employment (e.g., mining, law enforcement, or construction) (Collins, 2015). As a result, both the awareness of appropriate conventions to address trans individuals and the predisposition to adapt one’s language to suit their needs may be lower among employees working in these settings. Given shifting organizational discourses around the importance of diversity and inclusion, we also expect individuals in more senior roles (e.g., managerial and executive positions) to “lead the way” in terms of using inclusive language for trans employees (Cottrill et al., 2014). Altogether, we hypothesize that the degree of comfort using trans-affirming language will be greater amongst employees working in urban areas, certain industries/sectors, and those occupying senior roles (Hypothesis 3). Another plausible influence is the organization’s size. On the one hand, smaller firms may provide enhanced opportunities for meaningful inter-personal contact with individuals from gender and sexual minorities (Tee & Hegarty, 2006). On the other hand, larger firms tend to have greater resources to allocate to diversity training and awareness and formal channels to combat workplace discrimination and harassment (Day & Greene, 2008). Given these competing forces, we make no a priori predictions about the relative levels of comfort using trans-appropriate language among employees in smaller and bigger organizations.
Finally, a positive workplace climate cultivated through inclusive policies and practices should encourage organizational citizenship behaviors, including the use of inclusive language (Nishii, 2013; Panicker et al., 2018). This should apply most strongly to organizations that score highly in objective and externally defined markers of workplace diversity and inclusion in the space of gender and sexuality. Thus, our final hypothesis is that the degree of comfort using trans-affirming language will be greater among employees in organizations with highly inclusive climates (Hypothesis 4).
The Australian Context
We study the individual and organizational predictors of trans-inclusive language in the workplace in a relatively progressive country: Australia. Public attitudes toward LGBT issues in Australia have become substantially more supportive in the last few decades (Perales & Campbell, 2018). In a cross-country survey measuring attitudes toward homosexuality, Australians averaged 6.3 on a scale of 1 (low acceptance) to 10 (high acceptance) over the 2001–2014 period, a substantial increase from an average of 4.2 in the previous two decades (Valfort, 2017). Attitudes toward trans individuals, more specifically, are difficult to gauge due to the scarcity of suitable data (Valfort, 2017). One exception is a 2016 survey conducted by Ipsos and the Williams Institute, where Australia ranked eighth of 23 countries in relation to public support for transgender rights.
Australia has also made significant inroads in improving legal protections for sexual and gender minorities in recent years. In 2013, the Sex Discrimination Act 1984 was amended to explicitly prohibit discrimination on the basis of a person’s sexual orientation, gender identity, or intersex status (Australian Human Rights Commission, 2014). The Act encompasses key areas of public life, including employment, education, housing, and the provision of goods and services (Australian Human Rights Commission, 2013). Another important milestone was the legalization of same-sex marriage in 2017, which paved the way for couples to marry regardless of sex or gender (Perales & Campbell, 2018; Riseman, 2019). While Australia’s legal protections toward LGB people rank highly in international comparisons (OECD, 2020), Australia lags behind the OECD average in relation to laws protecting gender minorities (OECD, 2020). For example, unlike countries such as France, Germany and the Netherlands, Australia still requires trans binary people to undergo medical procedures to change their legal gender (OECD, 2020). This is consistent with Riseman’s (2019) observation that trans and intersex rights and acceptance were somewhat slower than LGB rights to enter the Australian public agenda. Indeed, recent Australian evidence points to the existence of significant barriers to inclusion amongst trans people, in the workplace and otherwise (Bates et al., 2020; Jones, 2016; Sullivan, 2018). In the next section, we describe the data and methods that we deploy to examine trans-inclusive language in the workplace within this institutional context.
Data and Methods
Dataset and Sample
Pride in Diversity is a program of ACON, Australia’s largest not-for-profit Lesbian, Gay, Bisexual, Trans, and Queer (LGBTQ) community health organization. The program was set up to provide employer support for all aspects of LGBTQ workplace inclusion. Since 2011, Pride in Diversity has monitored LGBTQ workplace inclusion policies and practices through its Australian Workplace Equality Index (AWEI). A key component in this task is an annual, repeated cross-sectional, national employee survey aimed at documenting the impact of LGBTQ inclusion initiatives on organizations and their employees: the AWEI Employee Survey (Pride in Diversity, 2019). This study is based on data from the 2020 AWEI Employee Survey, the ninth and largest iteration of the employee survey. This is a voluntary, online survey issued to employees within organizations that either were members of Pride in Diversity or that participated in the benchmarking process as non-members. These organizations encompass a wide range of sectors and industries. A total of 26,700 individuals completed the survey module on inclusive language use. After losing approximately 3% of cases due to missing data on the covariates, the final analytic sample encompasses 25,776 to 25,815 individuals (depending on the model) from 149 organizations.
The 2020 AWEI Employee Survey collects rich information on topics such as personal beliefs about inclusion, visibility of LGBTQ issues at work, ally behaviors, and workplace experiences. While there are some limitations associated with the online and voluntary nature of the survey (including an over-representation of individuals from gender and sexual minorities), these are far outweighed by the novel insights into processes of workplace inclusion that this unique dataset can offer.As we discuss later, the nature of our analyses makes them less vulnerable to the selection bias typically associated with non-probability samples.
Survey Measures
We use the AWEI Employee Survey data to derive two outcome variables tapping into different dimensions of language use towards trans employees. The questions ask the full sample of respondents to rate their degree of agreement with the following statements: (1) “I would be comfortable using they/their/them personal pronouns for a non-binary person at work” and (2) “I would be comfortable referring to a colleague by a different name or personal pronouns if they were affirming their gender (transitioning) at work”. Responses are in a Likert scale going from [1] “strongly disagree” to [5] “strongly agree.” As seen in Table 1, a majority of survey respondents “agree” or “strongly agree” with both propositions, although there is some variation across statements.
The AWEI Employee Survey allows us to derive an encompassing set of variables capturing individual- and employer-level factors that may predict inclusive-language use toward trans employees, and which are used as explanatory variables in our models. These variables align with the theoretical factors discussed before, and fall into four blocks.
Respondents’ gender and sexual identity is captured through an exhaustive and mutually exclusive set of eight dummy variables distinguishing between the following categories: cisgender heterosexual man, cisgender heterosexual woman, cisgender non-heterosexual man, cisgender non-heterosexual woman, trans man, trans woman, trans non-binary (assigned male), and trans non-binary (assigned female). We also include an additional dummy variable for individuals who did not provide sufficient information to be classified into these categories.
Respondents’ socio-demographic characteristics include the respondent’s age (six categories ranging from “ < 24 years” to “65 + years”), highest educational attainment (six categories ranging from “primary education” to “postgraduate degree”), and dummy variables (0 = No, 1 = Yes) capturing whether respondents identify as coming from a culturally and linguistically diverse (CALD) background, being Indigenous, and being religious.
Employment-related characteristics include workplace location (urban, regional, rural, remote), industry (24 categories), sector (federal/state/local government, higher education, private, not-for-profit), and organization size (four categories from “small ( 8000 employees),” as well as the respondent’s position within the organization (senior and executive level, middle management, regular employee).
Workplace environment is approximated through the use of the 2020 Australian Workplace Equality Index (the Index), a composite measure capturing the quality of an organization’s LGBTQ-inclusion policies and practices. The Index is constructed by adding up scores on separate dimensions, such as human-resource policies, diversity practices, employee networks, training and professional development, and community engagement—for details, see Pride in Diversity (2019). To make the Index comparable between small and standard employers (which are subjected to different scoring mechanisms), we collapse the raw scores into quartiles. Organizations in the top quartile (Q4) have the most inclusive LGBTQ policies relative to other participating organizations.Footnote1
Descriptive statistics on all explanatory variables are presented in Table 1.
Analytic Approach
To examine the associations between the explanatory variables and each of the ordered outcome variables capturing respondents’ comfort using trans-affirming language, we estimate two ordered logistic regression models—one for each outcome. To ease interpretation, the model coefficients on the explanatory variables are exponentiated and thus expressed as odds ratios (ORs). The ORs give the probability of being in a higher (compared to an equal or lower) level of the ordered outcome variable associated with a one-unit increase in a given explanatory variable, controlling for all other variables in the model. ORs greater than one denote positive associations with inclusive language use, whereas ORs smaller than one denote negative associations.
Empirical Evidence
Main Analyses
The results from our multivariable ordered logistic regression models are presented in Table 2. Columns 1 to 3 show the results for the model pertaining to the degree of comfort using they pronouns to refer to a trans non-binary person at work, whereas columns 4 to 6 show the results for the model pertaining to the degree of comfort using different names and pronouns for a colleague undergoing a gender transition.
Table 2 Odds ratios from ordered logistic regression models of trans-inclusive language use
In both models, respondents who identify as cisgender heterosexual men (the reference category) were significantly less likely to be comfortable using trans-inclusive language at work than all other groups, all else being equal. This can be inferred from the fact that the ORs for all of the gender/sexuality categories in the model were greater than one and statistically significant. Women were more likely to be comfortable using trans-inclusive language than men in the cisgender heterosexual, cisgender non-heterosexual, and trans groups. This is evidenced by larger ORs among women than men, with such differences being statistically significant in Wald tests.Footnote2 In both models, trans women were the most likely to be comfortable using trans-inclusive language in the workplace, followed by trans non-binary individuals. The magnitude of these associations was substantial, as can be grasped from the average marginal effects presented in columns 3 and 6. For example, the probability of falling into the strongly agree category of the outcome variable was 55.2% (model 1) and 50.8% (model 2) higher for trans women than for cisgender heterosexual men. Overall, these results are highly consistent with Hypothesis 1, which posited that women and individuals from gender/sexual minorities would be more likely to use trans-affirming language than cisgender heterosexual men.
Socio-demographic Characteristics
The results for the socio-demographic variables also offer empirical insights that align largely with our theoretical predictions. Consistent with Hypothesis 2, age was negatively and linearly related to comfort using trans-affirming language in both models. For example, the odds of expressing higher levels of comfort using they pronouns among employees aged 65 + years were 0.374 times (p < 0.01) those of employees aged 24 years and younger—which translates into a 22.6% lower probability of falling into the strongly agree category. Similarly, religious individuals were substantially less comfortable with inclusive language than their non-religious peers, all else being equal. For instance, the odds of expressing higher levels of comfort using a new name and pronouns for a colleague who transitioned decreased by a factor of 0.435 (p < 0.01) among religious compared to non-religious employees. This equates to a 17.4% lower probability of selecting the strongly agree response option. We also observed a clear positive gradient in trans-affirming use by employees’ level of education, ceteris paribus. As an example, individuals with a bachelor degree exhibited significantly higher levels of comfort than individuals with secondary education using they pronouns (OR = 1.221, p < 0.01) and using the correct name and pronouns for colleagues who transitioned (OR = 1.127, p < 0.01). In contrast, against the predictions in Hypothesis 2, we found no statistically significant differences in the degree of (dis)comfort concerning trans-affirming language use between employees with and without a CALD background. Neither were there differences by Indigenous identification.
Employment-Related Factors
Our theoretical framework also led us to expect certain employment-related characteristics to be associated with the use of trans-affirming language at work (Hypothesis 3). Consistent with these hypotheses, the models showed that the distance from urban areas is inversely related to comfort using trans-affirming language. For instance, compared to the reference category of “urban area,” the ORs for the category “remote area” were 0.597 in model 1 (p < 0.01) and 0.648 in model 2 (p < 0.01). In the metric of predicted probabilities, these ORs equate to decreases in the probability of strongly agreeing with the statements presented of 10.8% and 8.9%, respectively. Also consistent with expectations, employees who hold more senior positions within the organization expressed greater comfort using inclusive language toward their trans peers than other employees, all else being equal. As an example, the odds of reporting higher levels of comfort using they pronouns among regular employees decreased by a factor of 0.681 (p < 0.01) compared to senior leaders—or an 8% decrease in the probability of selecting the strongly agree response option. The results further revealed significant heterogeneity in inclusive-language use across industry sectors, with remarkable consistency across both models in the sectors that performed better (e.g., education, community services, and research and development) and those that performed worse (e.g., recruitment, health and wellbeing, property, and law enforcement).
While we made no explicit predictions concerning employer size, we found that employees in the smallest organizations exhibited the greatest adjusted levels of comfort using trans-inclusive language. For instance, the odds of individuals being comfortable using the correct name and pronouns of trans colleagues in organizations with 8000 + employees were 0.710 times (p < 0.01) those of employees in organizations with less than 500 employees. This is equivalent to a 6.7% decrease in the probability of strongly agreeing with the statement.
Organizational Climate
As posited in Hypothesis 4, we found that employees in those companies who scored highly on the inclusion Index exhibited greater levels of trans-affirming language use, ceteris paribus. For example, organizations in the top quartile of the Index had ORs that were 1.233 times (model 1) and 1.181 times (model 2) greater than those of organizations in the lowest Index quartile (p < 0.001 in both cases). That is, individuals in the most inclusive organizations had a 3.3 to 4.4% lower probability of selecting the strongly agree category, all else being equal.
Despite strong evidence of significant factors associated with inclusive language use in both models, our variables collectively explained approximately 8–9% of the variance in the outcomes of interest (as denoted by the pseudo-R2 values). This pattern of results serves to underscore the diversity of observed and unobserved factors that contribute to individuals’ embracing inclusive workplace language.
Sensitivity and Additional Analyses
To ascertain the robustness of our findings to different analytic decisions, we implemented a range of sensitivity analyses and specification checks, with reassuring results (see Tables A1 to A3 in the Online Supplementary Materials). First, we confirmed that the pattern of results was similar when we treated our ordered outcome variables as cardinal variables within a linear model (Column 2, Tables A1 and A2). Second, we examined whether results changed when implementing more complex multilevel models where individuals (Level 1) are nested within organizations (Level 2). The patterns of association were highly consistent to that in our main analyses in models treating organization-level heterogeneity as a random effect (column 3) and as a fixed effect (column 4).Footnote3 Third, it could be argued that the inclusion Index taps into some of the mechanisms that may connect other organizational characteristics to employees’ levels of comfort using trans-affirming language. This could lead to downward-biased estimates on the organizational characteristics. For this reason, we replicated our main models excluding the Index (column 5). Reassuringly, the estimated model coefficients on the organizational characteristics remained similar. Fourth, since employment sectors overlap to a large extent with industry sectors, we fitted separate models including the former instead of the latter. The results of these alternative specifications are presented in Table A3 and reveal theoretically meaningful differences in inclusive-language use across employment sectors. All else being equal, employees in the not-for-profit sector expressed the greatest levels of comfort using inclusive language across both models, followed by those in the higher-education sector, those in the private sector, and, finally, those in the public sector. Finally, we examined whether the industrial differences observed had their roots in a culture of hegemonic masculinity. We accomplished this by replacing the original set of industry dummy variables with a continuous-level variable capturing the percentage of AWEI Survey respondents who identified as cis-gender heterosexual men in the respondents’ industry of work. A greater percentage of cis-gender heterosexual men in the industry were associated with lower odds of an employee being comfortable using trans-affirming language—irrespective of the employee’s own gender or sexuality (Table A3). This suggests that a culture of hegemonic masculinity is partially responsible for industrial disparities in use of trans-affirming language.
Discussion and Conclusion
Despite strong evidence indicating that trans individuals occupy disadvantaged positions within the labor market, we know very little about the factors that facilitate their workplace inclusion. In this study, we have contributed to filling this gap in knowledge by theorizing and empirically examining processes of workplace inclusion among trans individuals, with a focus on the underexplored domain of language. Through innovative use of a large-scale, linked employer-employee dataset and multivariable statistical modelling, we were able to generate unique insights into the individual- and employer-level factors associated with the use of trans-affirming language in Australian workplaces.
Consistent with our first hypothesis, employees’ own gender and sexuality were powerful predictors of their language practices toward trans colleagues. Specifically, we found that women and people from gender and sexual minorities were more comfortable using inclusive language when addressing their trans peers than cisgender heterosexual men. As discussed before, the magnitude of these associations was fairly substantial. These results may reflect a greater degree of awareness about inclusive language among trans people themselves (see Zimman, 2017), as well as among individuals from sexual minorities. They also indicate that as previously reported for attitudes toward same-sex relations (Perales & Campbell, 2018) and overall use of inclusive language (Patev et al., 2019)—cisgender heterosexual men also lag behind in the adoption of inclusive language practices toward trans colleagues. Interestingly, cis-gender non-heterosexual men were less comfortable using trans-affirming language than individuals from most other groups. This finding is consistent with earlier studies documenting differences in support for hegemonic masculinity across sexual- and gender-minority groups (see, e.g., Ozturk et al., 2020), and underscores the importance of considering “diversity within diversity” when examining individuals’ support for gender (non-)traditional practices.
Our second hypothesis pertained to other socio-demographic traits of employees, besides their gender and sexual identity. Consistent with expectations, we observed higher levels of comfort using trans-affirming language amongst younger, more educated, and non-religious employees—with moderate effect sizes. These associations resemble those reported by previous studies examining socio-demographic correlates of attitudes toward LGBTQ issues (Perales & Campbell, 2018). Contrary to our expectations and to this literature, however, we found no differences between CALD employees and other employees. Neither did we find differences between Indigenous and non-Indigenous employees. This pattern of results suggests that ethno-migrant background is not an important factor in structuring the use of inclusive language in relation to trans issues within Australian workplaces. It is possible that many CALD and Indigenous employees are more acutely aware of inclusion issues due to their own minority identities, but also that this is offset by some subgroups within these umbrella categories holding traditional values about gender and sexuality. Further, people from CALD backgrounds who are native speakers of languages that accommodate gendered and non-gendered pronouns to various degrees may differ in the ability to adopt they pronouns when speaking English. Either way, our findings point to the importance of future research exploring inter-group heterogeneity.
Following multilevel approaches to conceptualizing workplace inclusion, we hypothesized that certain employer-related characteristics would foster or inhibit the use of trans-affirming language—net of differences in employees’ socio-demographic traits. Our analyses yielded support for this hypothesis, indicating that factors such as employer’s location, industry, and sector were all important determinants of inclusive language use. Specifically, better practices were observed in urban, not-for-profit, and higher-education employers compared to regional, rural, private-sector, and public-sector employers. None of these associations came as a surprise, as they resemble patterns that have been identified between the same employer-related factors and other markers of workplace inclusion—such as rates of harassment or discrimination (Brolis et al., 2018; Saunders & Easteal, 2013).
The industrial and sectoral differences observed are important and, in some cases, a cause for concern. Employees in the public sector and those in certain industries aimed at safeguarding and enhancing people’s welfare (e.g., health and wellbeing, law enforcement, and recruitment) were significantly less likely to be comfortable using trans-affirming language. The fact that employees in the health and wellbeing sector were among the least inclusive resonates with literature documenting challenges in accessing healthcare for individuals from diverse genders and sexualities (Puckett et al., 2018). These individuals often report postponing or avoiding treatment due to a fear of being stigmatized or discriminated against (Grant et al., 2010; Puckett et al., 2018), and non-inclusive language is recurrently cited as an instance of these experiences (Goldberg et al., 2019). The results regarding employees in law enforcement and recruitment echo those of previous studies showing that trans individuals routinely experience discrimination from the police and during the hiring process (Grant et al., 2011). Apart from reinforcing stigma against trans employees, these patterns may also harm organizations indirectly by reducing their effectiveness and restricting their capacity to attract talent (Mallory et al., 2015; Badgett et al., 2013).
Individuals’ positions within the organization were also important, with more senior employees “leading the way” in the use of trans-inclusive language. This finding underscores the significant role that managers, supervisors, and senior executives can play as innovators in the space of workplace inclusion, through leadership and role modeling (Boekhorst, 2014; Mor Barak, 2015). Our results also revealed that employees in firms that had attained higher scores in an Index of diversity and inclusion practices in the workplace were more likely to use inclusive language. This finding was consistent with our fourth and final hypothesis and speaks to the importance of cultivating workplace environments that promote understanding and respect of the needs of employees with diverse genders and sexualities. While we did not have a priori expectations about firm size, our empirical results suggested that trans-affirming language was more prevalent in smaller rather than larger firms. This finding aligns with perspectives emphasizing greater flexibility to encourage behavioral change within smaller firms (Richard et al., 2013) and that these firms provide greater opportunities for meaningful interpersonal contact, which can in turn help overcome stereotypes and stigma (Pettigrew & Tropp, 2006). It also aligns with previous research findings indicating that small firms benefit the most from inclusive workplace practices (Sels et al., 2006).
In relation to theory, our findings confirm the usefulness of theoretical frameworks that conceptualize workplace inclusion as a multilevel process, recognizing the significant contributions made by both individual- and employer-level factors. Research that considers only either set of processes is likely to offer only a partial picture of the factors motivating inclusive language use within the workplace. However, despite the richness of the data and high number of covariates, our models explained only a modest amount of the variance in language use among employees (approximately one tenth). This underscores the multifaceted and complex nature of workplace inclusion processes, including those pertaining to language. It also suggests that future studies should consider additional factors not measured here as plausible drivers of such processes. Based on previous research, putative candidates may include employees’ personality traits, cognitive styles and frequency of contact with trans people at the individual level, and organization’s staffing profiles and presence or visibility of trans people at the aggregate level. The examination of cross-level interactions between socio-demographic factors and employer-level characteristics also constitutes a potentially fruitful way to expand the explanatory power of the models presented here.
Despite the novel insights and important contributions of this study, a noteworthy caveat of the AWEI Employee Survey is that, like other opt-in online surveys, it is prone to selection issues. First, the potential covered population (i.e., all employees of participating organizations) may not be fully representative of the target population (i.e., all employees in Australia). This could result in under-coverage bias (Valliant & Dever, 2011). Second, the realized sample (i.e., all respondents) may not be fully representative of the potential covered population and/or the target population (Valliant & Dever, 2011). In relation to this, the non-probabilistic nature of the sample means that the use of inferential statistics is contingent on several untestable assumptions. Nevertheless, selection bias is likely to be comparatively small for our purposes. This is because results from non-probability surveys are less likely to be biased when analyses focus on relationships between variables rather than on point estimates (Pasek, 2016). In addition, there is growing recognition that surveys need to be evaluated not only on their statistical features, but also on their “fitness for use” (Baker et al., 2013, p.98). In this regard, use of the AWEI Employee Survey is fully justified by its incorporation of unique information that is currently unavailable in population-based survey in Australia—and rarely available internationally. A second, more minor, limitation is that our outcome variables measured employees’ comfort using trans-inclusive language, rather than their actual use. Nevertheless, we expect these two constructs to be strongly correlated.
Despite these limitations, our findings yield important lessons for workplace inclusion policies. At a broad level, the results underscore the need to address not just formal types of discrimination against trans employees, but also informal forms occurring at the interpersonal level. However, they also highlight the value of moving beyond “blanket approaches” to providing inclusive workplace climates for different groups of workers (Ozturk & Tatli, 2016, p.797). Instead, organizational policies and practices need to be tailored to suit the specific needs and unique experiences of trans workers—including the use of trans-affirming language. This is a crucial endeavor, as cumulative experiences of informal discrimination can have profound, negative effects on trans people’s employment trajectories (Ozturk & Tatli, 2018).
Further, the present study confirms the existence of barriers to the use of trans-inclusive language that are unevenly distributed across employee and employer “types” (Kelly et al., 2020; Patev et al., 2019). To the extent that socio-demographic characteristics reflect attitudinal, cognitive, or language-related barriers, efforts need to be directed toward educating employees concerning the appropriate use of names and pronouns when addressing their trans colleagues (Sawyer et al., 2016). In this regard, our findings are invaluable in qualifying which employees and which employers are more likely to require training and support in adopting trans-affirming language, paving the way for more targeted and efficient interventions. Specifically, training programs that manage to engage cisgender heterosexual men; older, less educated, and religious employees; and workers in non-managerial roles have a greater chance to make a genuine difference. Similarly, training needs seem particularly acute in large firms; employers without a strong track record of overall inclusion practice; public- and private-sector employers; and organizations within certain industries (e.g., recruitment, health and wellbeing, and law enforcement).
Finally, our study reaffirms the importance of organizational policies and practices aimed at fostering an inclusive environment for trans employees. Specifically, organizations should adopt policies that facilitate appropriate language use toward trans employees affirming their gender identity, including the recognition of new names and pronouns through informal channels and in formal document and communications (Sawyer et al., 2016). Examples of positive practices include—but are not limited to—incorporation of non-binary options when asking about employees’ gender, enabling employees to self-select their personal pronouns within human-resource systems, and ensuring congruence in salutation fields on forms.
Our findings also point to important avenues for further research. First, our theoretical model linked socio-demographic and employer-level characteristics to trans-affirming language through cognitive, language, and attitudinal factors. However, we were unable to explicitly capture these factors in our empirical models and doing so would enable the refinement of interventions aimed at fostering inclusive language in the workplace. Qualitative research is perhaps best placed to identify the precise nature of the mechanisms (both barriers and facilitators) implicated in these processes—for example, through in-depth interviews or focus groups with employees whose comfort levels using trans-inclusive language are distinctively high and low. Second, the field would benefit from new studies that undertake similar analyses to those presented here in different country contexts. As described before, Australia represents a relatively supportive institutional environment for individuals with diverse genders and sexualities. Identifying whether or not our findings hold in less supportive (e.g., the USA) or more supportive (e.g., the Netherlands) countries, and the macro-level factors that may moderate the relationships of interest, represent important pathways for further inquiry.
To conclude, while use of appropriate language toward individuals with diverse genders and sexualities constitutes an important stepping stone to their workplace inclusion, this study has demonstrated that its adoption remains incomplete and highly segmented. Greater efforts should be directed at understanding what drives inclusive language use across workplaces, and at devising policies and programs that encourage employees to embrace it.
Data, Materials, and/or Code Availability
The data used in these analyses were provided by Pride in Diversity. Inquiries regarding the data access should be addressed to awei@prideindiversity.com.au. The syntax code used to generate the findings presented in this study can be obtained from the lead author upon request.
Notes
1.
Because information on employer size and Index scores is only available for organizations that participate in Pride in Diversity’s benchmarking process, we use dummy variables to flag cases with missing data on those variables.
2.
Concerning comfort using they pronouns, Wald tests showed statistically significant differences between cisgender heterosexual men and women (χ2(1) = 1056.10, p < 0.001), cisgender non-heterosexual men and women (χ2(1) = 151.93, p < 0.001), and trans men and women (χ2(1) = 16.09, p < 0.001). The same pattern of results emerged in the model for using different pronouns for trans colleagues.
3.
In fact, inspection of the intra-class correlations revealed that organization-level factors explained only 4.22 to 4.87% of the total variance in the outcome variables in linear random-effect models with no predictors, and 0.33 to 0.34% of the unobserved variance in fully specified linear random-effect models.
written by Dawn Emsen-Hough, Director, ACON's Pride Inclusion Programs | 1 September 2020
This year the AWEI 2020 annual survey of employees working within organisations active in LGBTQ inclusion saw a response rate of 33,572 of which 20.21% (n6,787) identified as being of diverse sexuality and/or gender. This article summarises what this data tells us about our active allies (those who actively support LGBTQ inclusion within their workplaces) and explores reasons as to why others may be more passive in their approach.
Active vs Passive Allies
There is a difference between active and passive allies. A passive ally may support LGBTQ inclusion initiatives, agree that it is important work and acknowledge the positive impact that LGBTQ inclusion initiatives are having on the organisational culture – but do they make a difference to the experience of LGBTQ people in the workplace? The answer is typically ‘no’.
It's the visibility of active allies that makes the difference
In surveying LGBTQ respondents regarding the visibility of executive allies within their organisation and other allies within their immediate work area, the results were somewhat disappointing given the focus on allies within recent years. Only 61% of 5,869 LGBTQ respondents knew of executive allies within their organisation and only 66% of 5,866 LGBTQ respondents knew of allies within their immediate work area.
These results made us question the impact that allies were having on LGBTQ people. While initially, it looked as if only 53.1% strongly agreed or agreed that active allies positively impacted their sense of inclusion within the current workplace, that number rose to 65.84% when we filtered only those LGBTQ people for whom active allies were visible. The more visible the active ally to the individual, the greater the sense of inclusion.
Why aren't people active allies if they support inclusion.
68% of all non-active allies are happy to support LGBTQ inclusion passively; which indicates that the support is there. 49.5% of people who were not active allies stated that they were just too busy. 45.3% stated that they just didn’t have any interest in the area. We may not be able to do a lot about this. However, the next two commonly cited reasons for not being an ally, we can do something about. 42.8% of people who were not active allies stated that they didn’t know enough about how to be an active ally and 34.6% stated that they didn’t know enough about why they should be one. So our next questions should be:
Will ramping up our education or resource materials for allies help shift people from non-active allies to active?
Are people thinking that being an active ally requires a significant amount of time? Is this what is holding people back?
Are people aware of why allies are so important?
Are we providing enough information on how time-poor people can be active allies?
We filtered the data by several key questions to determine just how supportive passive allies are. We compared those who neither agreed nor disagreed that they were active allies with those who disagreed or strongly disagreed. This is what we found:
In summary:
Between 67% and 83% of all non-active allies supported the work of LGBTQ inclusion
The majority (55%-71%) believed that work in this area had a positive impact on the organisation’s culture
And more than half (52.9%-67.1%) believed that training in this area should be mandatory for all people managers.
WOMEN ARE MORE INCLINED TO BE AN ACTIVE ALLY THAN MEN
We wanted to filter the data by various demographics to see if we could pinpoint any patterns in active ally support. For non-LGBTQ respondents, women were 19% more likely to be active allies than men (66% vs 47%) with their top two reasons for not being active stated as ‘don’t know how’ and ‘too busy’. While men also stated ‘too busy’ as being their second most identified reason, their top reason was identified as not having a personal interest in this area.
Interestingly, only 77% of LGBTQ respondents agreed or strongly agreed that they were active allies. Being too busy was their top reason for not being an active ally closely followed by ‘don’t know how’. 5% of LGBTQ respondents responded with ‘not applicable’. This begs the question of whether we need to provide any specific guidance as to how LGBTQ people can be allies for others within their community and how.
ARE OUR LEADERS OUR MOST ACTIVE LGBTQ ALLIES OVERALL?
One of the most interesting findings for us was the clear pattern of declining active allyship once we start to move down traditional reporting lines. The further down the reporting lines, the smaller the number of active allies and the greater the number of those who disagree or strongly disagree that they are active allies.
We could hypothesise from this data that visible inclusivity is more important, the higher we move up traditional organisational hierarchies. We have long spoken of inclusion being a valued leadership quality and the higher someone moves within traditional hierarchies the more important this behaviour becomes. If this is correct, then what we appear to be missing is the clear message of its importance as we move further down the line. Is the importance of inclusive behaviour (regardless of the diversity dimension we are focusing on) being communicated enough as a valued leadership quality or is it about greater accountability and reward for those people managers who exhibit these behaviours within our organisations.
Clearly there is still much to be done in terms of communicating the importance of inclusive leadership. Our leaders appear to understand and engage in this, we now just need to look at how we can filter that behaviour down the reporting lines.
For more information on AWEI2020 findings, visit: http://www.pid-awei.com.au/2020practicepoints/
Permission is given to cite any of the data within this factsheet providing the reference above is utilise
How inclusive are our workplaces of trans and gender diverse employees?
written by Dawn Emsen-Hough, Director, ACON's Pride Inclusion Programs | 17 August 2020
In the 2020 Australian Workplace Equality Index (AWEI) Employee Survey, 33.572 employees working within organisations active in LGBTQ inclusion responded to questions in regard to LGBTQ inclusion initiatives within their organisation. Of those respondents 20.2% (n6787) identified as LGBTQ (Lesbian, Gay, Bisexual, Transgender, Queer). 8.61% of LGBTQ respondents (n582), identified as being gender diverse. Of gender diverse respondents, 296 (just over 68%) identified as having a trans history or experience. 40.38% of trans and gender diverse respondents (n235) identified as non-binary.
The survey this year focused on a number of questions specific to the inclusion of trans and gender diverse employees. It sought to (a) provide insight into the general perceptions of those who worked within organisations active in this space and (b) gain a better understanding of the lived experience of trans and gender diverse employees within these organisations.
This article seeks to summarise some of the key findings, however further insight can be gained via the Practice Points articles published on 3rd June : http://www.pid-awei.com.au/2020practicepoints/
General views - all respondents (n33,572)
We asked a series of questions in regard to (a) how supportive people were in terms of their employers work in LGBTQ inclusion and (b) how active or proactive people were themselves in terms of their inclusion of trans and gender diverse colleagues and team members.
82.1% of respondents overall supported LGBTQ inclusion activity. 91.7% felt that a gender diverse person would be welcome within their team and treated no differently to anyone else. 86.2% of respondents felt that if a member of their team were to affirm their gender, they would be supported within their immediate team and 86.8% of respondents said they would be comfortable referring to a colleague by a new name or personal pronoun should they affirm their gender.
However in terms of believing that there are more than two genders, only 52.6% agreed. Regardless of this, 78.4% said that they would be comfortable using they/their/them personal pronouns for a non-bineary person at work.
On the topic of all gender or gender netural toilets, a topic that tends to divide people more than any other, we do see some decline in support. Disappointingly only 78% of respondents said they would be comfortable with the inclusion of an all gender or gender neutral toilet on their floor even if male/female toilets were still available. Not surprisingly then, the support for all toilets being changed to all gender or gender neutral was low with less than half (46%) of all respondents claiming that they would being comfortable with this.
We were interested to see how the views of LGBTQ people vs non-LGBTQ people differed on this topic. In terms of the inclusion of all gender or gender neutral toilets alongside male/female toilets, LGBTQ people were 13.54% more comfortable than non-LGBTQ people (89.02% vs 75.48%). Comfort levels dropped quite significantly for both groups when it came to all toilets being all gender or gender neutral (65.43% LGBTQ people vs 40.53% non-LGBTQ were comfortable with this).
Lived experience of trans and gender diverse employees
Of all trans & gender diverse respondents, 427 (73.37%) identified as non-heterosexual. When it came to disclosure at work, 38.41% were out to everyone at work in regard to their sexual orientation while only 20.54% strongly agreed that most people they worked with were aware of their gender diversity.
In terms of the inclusivity of their workplace meeting personal expectations, the responses were mixed with 50% or more respondents agreeing that their expectations had been met or exceeded in only one of the areas of inclusion that we presented (visibility of inclusion for TGD (trans and gender diverse) employees).
While meeting expectations is a subjective experience, it can of course impact whether or not someone feels that they can be themselves at work which has numerous implications for productivity, engagement and an individuals overall health and wellbeing.
In terms of experience of inclusivity, alarmingly over 25% of respondents did not feel that they could use gendered toilets of choice without opposition and over 15% did not feel that people made an effort to use their personal pronouns. Just over 43% stated that they had been deliberately mis gendered within the last year.
63.7% of trans and gender diverse employees felt mentally well at work. 70.6% felt engaged with the organisation while 46% reported that inclusion initiatives have had a positive impact on how they themselves feel about their gender identity.
Jokes / Bullying & Harassment
13% of respondents reported being personally targeted with unwanted jokes/commentary in regard to their gender diversity, 7% experiencing more serious bullying. The majority (albeit only 60.3%) felt safe and supported reporting continual unwelcome jokes/innuendo to their manager although alarmingly, this number dropped to 58.9% when asked if they would feel safe and supported reporting more serious bullying/harassment.
In closing
In closing, while workplaces are actively doing more to support the inclusion of trans and gender diverse people, and more people are affirming their gender at work there is still considerable work to be done. On the surface it appears that there is significant support for LGBTQ inclusion and the overwhelming majority of non-LGBTQ people are supportive of those affirming their gender at work and feel that trans and gender diverse employees would be welcome and treated no differently within their team. Even when beliefs around gender differ, the majority of people are comfortable using less common personal pronouns (their/they/them) for colleagues.
Despite this, it is still unacceptable that only 47.4% of trans and gender diverse people feel safe and included within their immediate team and only 63.9% feel mentally well at work.
In addition, there is still a significant amount of work to be done around inclusive recruitment practices, in particular for our trans and gender diverse colleagues. An area that Pride in Diversity is committed to exploring further.
For more information data insights on the AWEI annual employee survey, please visit: http://www.pid-awei.com.au/2020practicepoints/
Are Australian employees going back into the closet?
written by Dawn Emsen-Hough, Director, ACON's Pride Inclusion Programs | 4 May 2020
This year, 33,572 employees from 170 organisations responded to the AWEI (Australian Workplace Equality Index) employee survey on LGBTQ workplace inclusion. Of those respondents, 5,413 identified as either being of diverse sexuality and/or gender. 5,276 of those respondents identified with a sexual orientation other than heterosexual. This paper discusses the extraordinary finding that suggests Australian employees are more likely to be in the closet and less likely to be completely out at work in 2020 than they were the year prior.
Respondents: Diverse Sexual Orientation
15.72% of these year’s 33,572 people responding to the AWEI survey identified as someone of diverse sexuality (n5,276). Every year we analyse this data to look for trends in terms of experiences of workplace culture, productivity, inclusion and the freedom to be out at work.
For the last nine years, we have found some consistent trends in regard to LGBQ employees. Firstly, the data has consistently shown that those who are younger are least likely to be out at work and more likely to be out to none. The second piece of consistent data is that the higher the organisation's score on the AWEI (national benchmarking instrument for LGBTQ workplace inclusion), the more likely their employees are to be out when compared to employees within organisations who are just starting LGBTQ initiatives or do not have high visibility of inclusion for people of diverse sexuality and/or gender.
As LGBTQ inclusion initiatives become more prominent in Australian workplaces, a greater number of employees have, year on year, felt more comfortable to be out at work; however this year our data shows a slightly different trend.
Are people really less likely to be out and more likely to be closeted than last year?
The first cut of the data this year shows that there is a 2% increase in the number of people who are more likely to be completely closeted at work and a 17.65% drop in those who are out to everyone at work. In contrast to previous years, these findings were out of sync in terms of projected impacts of inclusion; and were alarming to say the least.
To investigate further, we looked into the differences in language used between this years survey and last, isolated data where language did not differ between the years and further analysed particular demographic data such as age and gender in order to compare those figures to last year's figures.
Focusing on those who were completely out at work in terms of age, the numbers were down across the board but continued the pattern of our younger employees least likely to be out. In terms of gender, with the exception of those who are gender diverse, both men and women were less likely to be completely out at work when compared to last year.
Our next investigation was to determine whether there were more employees from "gold" (higher scoring) organisations participating in the survey last year. Our data clearly shows that the higher the score on the AWEI, the more likely their employees are to be out at work, speaking to the visibility of LGBTQ inclusion and the support felt by the employees. As we did find more "gold" employees participating last year, we further extracted the percentage of completely out employees working for gold employers and compared these numbers across both years.
Once again, the data supports the finding that even within gold employers, people are less likely to be "out to all" and more likely to be completely closeted at work. In 2019 63.74% of gold respondents were completely out; this year only 43.91%. Last year 9.27% of gold employees were not at all all compared to 14.18% this year. For those organisations participating in the employee survey, it would be interesting to see if your own organisational data reflects this trend.
Another finding that could possibly impact the numbers of those who chose not to be out at work is an increase in the visibility of unwelcome jokes/innuendo and mild harassment targeted people of diverse sexual orientation (2.22% increase overall) and an increase in the visibility of targeted serious bullying/harassment (3.11% increase overall). The number of people who were themselves the target of more serious bullying/harassment as a direct result of their sexual orientation also increased by 3.02%.
On the positive side, those who are out to everyone at work enjoyed higher levels of productivity, engagement and greater positive mental health and wellbeing at work.
To read more about these finding and other topics of AWEI analysis, please visit: http://www.pid-awei.com.au/2020practicepoints/
This paper was compiled by Dawn Hough, Director, ACON’s Pride Inclusion Programs.
Pride in Diversity annually publishes the key findings of the Australian Workplace Equality Index as part of the national benchmarking process for LGBTQ inclusion within Australian workplaces. This year 170 organisations participated in the survey with 33,572 employees responding. These reports focus on key findings within that survey. The benchmarking instrument and employee survey are published by the Pride in Diversity Program, ACON.
Data may be used with the reference AWEI(2020), Pride in Diversity, ACON, www.pid-awei.com.au
CALD Employees & LGBTIQ Workplace Inclusion
written by Dawn Emsen-Hough, Director, ACON's Pride Inclusion Programs | 16 October 2019
A focus of one of Pride in Diversity’s strategic initiatives is to investigate more thoroughly some of the unique challenges that culturally and linguistically diverse (CALD) LGBTIQ people face and specifically, how this plays out in the workplace. In addition, we were interested in understanding the views of non-LGBTIQ CALD employees in terms of their employers' inclusion activities.
As assumption commonly made is that those who come from a culturally or linguistically diverse background may be less supportive of LGBTIQ inclusion due to the fact that in many non-western countries homosexuality and/or gender diversity (non-cis) is frowned upon, illegal or in some countries punishable by death (see https://ilga.org/un-resolution-death-penalty-same-sex-relations).
We wanted to test this assumption of "less support" by extracting the survey responses of CALD employees within the 2019 Australian Workplace Equality Index data set and comparing views against the overall population set in addition to specifically comparing CALD and non-CALD employee sentiment.
While the results of the 2019 survey did not yield any data on the unique challenges that the intersectionality of faith/culture/sexuality/gender diversity may envoke; it did provide us with an overview view of CALD employee responses.
Of the 27,347 responses to the 2019 survey, 4,455 identified as coming from a CALD background. While 65% of respondents spoke English at home, the top 10 languages spoken at home (n1870; 41% of respondents) were: Mandarin (n279), Cantonese (n258), Spanish (n239), Hindi (n231), Italian (n188), French (n177), German (n155), Greek (n149), Vietnamese (n110), Portuguese (n84). The frequency of languages spoken at home is depicted within the following word cloud.
CALD Employee support for LGBTIQ Inclusion
Of all 4,455 CALD respondents, 90.5% voiced their support for LGBTIQ inclusion.
There was little difference between the views of CALD employees and the general population when it comes to LGBTIQ workplace inclusion.
When it came to reasons stated for not supporting LGBTIQ workplace inclusion, a relatively small number cited faith/beliefs (n135); cultural background/ethnicity (n74) or conservative upbringing (n60).
A combination of both annoyance and frustration was frequently expressed by CALD respondents re the assumption that any lack of support for LGBTIQ inclusion could or would be attributed to the fact that they came from a CALD background. Many stated that their cultural background, faith or beliefs were independent of any support given; that it was a personal view to stand for or against LGBTIQ inclusion, not one informed by cultural heritage or faith. Quite a number of people expressing feeling personally affronted by the stereotypical assumption.
Being sensitive and respectful to people of different faiths/beliefs while promoting LGBTIQ inclusion was also frequently raised. While many people participating within this survey fully supported LGBTIQ inclusion, they felt there was not the same level of reciprocal support for their cultural diversity, faith or background.
LGBTI CALD Employees
17.26% of all CALD respondents identified as LGBTIQ with 718 people identifying with a diverse sexuality; 45 identifying as someone with a trans experience or gender diverse and 9 being intersex.
Diverse Sexual Orientation
In terms of sexual orientation, CALD respondents were slightly less likely to be out at work, to managers and to family than the overall LGBTIQ population although the top reasons for not being out out at work completely aligned with non-CALD employees: not wanting to be labelled and just not being comfortable enough to be out at work.
The key impetus for being out, also aligned: the desire to be authentic at work and having the freedom to talk about life/partner/community
78% of all sexually diverse CALD respondents felt it was important to be out at work. 49.45% of those who were out regarding their sexual orientation reported being extremely comfortable with peers and colleagues as a result and equally reported positive impacts to the engagement of productivity, innovation, engagement and inclination to stay. 64.8% reported that LGBTIQ workplace inclusion initiatives have had a positive impact on how they feel about their orientation.
Trans Experience & Gender Diversity
45 CALD people identified as gender diverse or someone with a trans history.
48.89% of this population believed that the organisation was supportive of gender diverse employees, 26.67% disagreed.
70% of respondents felt that LGBTIQ workplace inclusion initiatives have had a positive impact on how they feel about their gender identity at work and 73% felt that workplace inclusion initiatives were important to their level of engagement.
Responses from trans and gender diverse CALD employees differed insignificantly from those of the broader trans/gender diverse population.
Intersex Employees
9 CALD employees identified as being intersex. While this is too small a number to draw any significant conclusions, findings again were very much aligned to
the broad intersex population of respondents.
62.5% felt that their organisation was inclusive of intersex employees and that current LGBTIQ initiatives were of benefit to intersex employees. 44% were open about being intersex at work.
written by Dawn Emsen-Hough, Director, ACON's Pride Inclusion Programs | 1 October 2019
In 2018, Pride in Diversity worked with PwC on a joint project called Where are all the women? This report investigated the low visibility and engagement of same-sex attracted women within workplace initiatives.
Many years of Australian Workplace Equality Index (AWEI) data has shown that women are less likely to be out at work than men; they are less engaged in network activities and that they highly value yet see very few out female role models in the workplace.
We wanted to investigate this year’s data to determine if there were any shifts or changes to the annual patterns that we have identified and to see if we could add additional insight to the findings identified in Where are all the women?
OUR AWEI 2019 DEMOGRAPHIC
To understand the dual challenges of being both a woman in the workplace and one of diverse sexuality, gender, or intersex we limited our search to LGBTIQ people who clearly identified as women. All up,we had 2190 LGBTIQ women respond.
How women describe their sexual orientation
How women define their sexual orientation varies greatly with a high number of women referencing an adversity to labels.
For those who chose to respond to a predefined list of orientations, the breakdown collected was as above. However, when given the opportunity to self-identify, the following word cloud gives an indication of word frequency.
Being out at work - Sexuality
The 2019 Survey once again shows that LGBTIQ women are less likely than GBTIQ men to be out at work; and when they are out, less likely to feel comfortable being out among their colleagues.
However when it comes to workplace inclusion, LGBTIQ women are 3% more likely to feel that LGBTIQ inclusion initiatives are important to a culture and 5% more likely to feel that OUT role models add to their sense of inclusion.
The fact that Gay/Lesbian women are much more likely to be out than Bisexual women is consistent with AWEI findings over the last 5 years. New to this year’s study was the inclusion of women who identify as Queer, Pansexual, Asexual and those with a trans history, and whether they are out regarding their sexual orientation (See full report for more details)
We asked women who were out at work whether being out had a positive impact on common engagement factors such as productivity, innovation, engagement, inclination to stay at an organisation etc. While the positive impact reported for out women was less than for out men, a significant number of women reported that being out did have a positive impact.
What was particularly interesting to us was the difference that being completely out at work made (as opposed to being out to selected people only). The reported difference on factors such as being more engaged, more productive, more inclined to stay within an organisation were notably higher for those who were completely than for those who were only out to selected people.
There is obvious benefit here for an organisation to create a workplace culture in which LGBTIQ women can be comfortable being out.
To add to the male/female comparison, LGBTIQ women are 28% less inclined than GBTIQ men to accept a role in an organisation that was not active in LGBTIQ inclusion (assuming comparable pay/work).
LGBTIQ Women the target of inappropriate behaviours
LGBTIQ women who are out at work are often the target of inappropriate jokes, commentary and/or innuendo as a direct result of their orientation. These comments are frequently sexualised and can be reason enough for many women to hide their sexual orientation.
The number one reason across all LGBTIQ women for not coming out at work is not wanting to be labelled; the second most commonly reported reason being not comfortable enough to be out at work.
Couple this with unwanted sexualised commentary it is not surprising that LGBTIQ Women are 4.3% more likely than GBTIQ men to feel that jokes and innuendo targeting sexuality are unacceptable and 15.4% more likely to call the negative commentary in their teams if they heard it.
When looking at the different identities of women within the LGBTIQ population and the instances of being the target of unwanted commentary and more serious bullying behaviours, women with a trans history were most impacted.
Gay/Lesbian Women & Bisexual Women
We were also interested in looking at some of the differences between the two largest groups of women within this cohort, Gay/Lesbian Women and Bisexual Women. The differences in terms of being out at work were significant.
While many of the remaining differences could be explained by the number of women out (or not) at work (ie. bullying/harassment related to one’s orientation); some of the standouts independent of this were:
When out, Gay/Lesbian women were 85% more likely than bisexual women to be comfortable being out at work among team members
Gay/Lesbian women were 16% more likely to feel that OUT female role models were important to their sense of inclusion
Gay/Lesbian women were 160% more likely than bisexual women to feel that it was important for them to be out at work
Gay/Lesbian women were 79% more likely to feel that LGBTI inclusion initiatives had a positive impact on how they felt about their orientation.
Gay/Lesbian women were also more inclined to report positive engagement impacts as a direct result of being out at work than bisexual women. Differences ranged from 14% (more likely to talk positively about my organisation) to 82% (more likely to report being more productive).
Women with a trans history
65 LGBTIQ women completing this year’s survey reported having a trans experience/history.
Of these women, 95.38% supported their organisations focus on LGBTIQ inclusion, 75.35% believing that their employer should be doing more in this space. 75% identified as having a diverse sexual orientation. We were interested in delving a little deeper into whether or not women with a trans history and diverse sexual orientation were out at work in regard to their sexual orientation; and whether they were open about their trans history.
For those who identified with a diverse sexuality, being out at work had a positive impact across several engagement factors; however, it appears that being open about one’s trans history had a greater impact. Highlighting once again the benefit of creating a safe environment for those who wish to be open.
It is important to remember however, that being open about ones trans history is not a precursor to authenticity for women with a trans history. For many women who choose not to disclose their trans history, they are being their authentic selves. For many, disclosing this history would be more detrimental than beneficial. However, for those who choose to disclose; the reported impacts where across several engagement leavers were higher than when disclosing orientation.
Women with a trans history: Recruitment challenges
Understanding the unique barriers that people with a trans history can face in terms of recruitment, this group identified the top four as identification documentation; general fears of being "outed"; reference checks (different names/gender); general fears of discrimination.
79.4% of women with a trans history were not aware of any information available or support for trans/gender diverse people when it came to the recruitment or on-boarding process. 78% of women with a trans history did not disclose their history during the recruitment process.
However, in terms of the organisation’s overall inclusivity 71% of women with a trans history believed that their manager genuinely supported LGBTIQ inclusion and 62.8% believed that visible LGBTIQ allies made a difference to their overall sense of inclusion. The most important ally behaviours for trans/gender diverse women were seen to be calling out inappropriate commentary/jokes and addressing or reporting bullying/harassment.
78% believed that the impact of LGBTIQ inclusion initiatives has had a positive impact on how they feel about their gender identity.
Intersex Women
With only 10 intersex women responding to the survey this year, the findings cannot be indicative of the population; however, to give a voice to those who did respond; it is worth noting that:
77% believed that their organisation was inclusive of intersex employees
40% were open about being intersex at work
There were no reported instances of being bullied or harassed as a direct result of being intersex
56% believed that LGBTIQ allies made a difference to their personal sense of inclusion; and
70% believed that Intersex inclusion should remain within LGBTIQ inclusion initiatives.
For more insights drawn from The Australian Workplace Equality Index (AWEI), LGBTIQ Workplace Inclusion Survey, visit: http://www.pid-awei.com.au/practicepoints.
LGBTIQ Allies in the Workplace
written by Dawn Emsen-Hough, Director, ACON's Pride Inclusion Programs | 13 September 2019
The Australian Workplace Equality Index (AWEI) incorporates Australia's largest annual workplace inclusion survey designed to explore the impact of LGBTIQ Inclusion initiatives in the workplace. The survey captures the thoughts and perspectives of non-LGBTIQ people who work in organisations active in LGBTIQ inclusion, while exploring the impact of these initiatives on LGBTIQ employees. The 2019 survey conducted in February/March this year captured 27,347 employee responses, of which 22.5% of employees participating were LGBTIQ identifying.
In this article, we look at how many of our non-LGBTIQ respondents identified as allies and the types of activity that allies undertook at work to promote LGBTIQ inclusion. We also look at how many people chose NOT to identity as an ally, asking why to determine any barriers faced or activities that workplaces could undertake to increase ally numbers.
Supportive but not active
While a staggering 91% of the 21,191 non-LGBTI respondents supported LGBTIQ workplace inclusion; only 58% identified as an ally, with an additional 22% stating that they were unsure. These numbers are down from last year but this may be due to us defining what we meant by ally within the survey instrument. To differentiate between those who were active and visible allies in the workplace and those who were "allies in principle", we defined an ally as "someone who supports the creation and maintenance of an LGBTIQ inclusive workplace environment and is prepared to openly support their LGBTIQ colleagues by participating within the organisations LGBTIQ inclusion initiatives".
We felt that a silent, inactive ally offered very little value to the work of inclusion if (a) nobody knew that they were any ally; and if (b) they did not openly support LGBTIQ colleagues or participate in inclusion activities. While the support is nice, if it's not visible, it's non-existent.
While the definition utilised this year within the survey may count towards a decline in ally numbers, we were pleased to note evidence of broader acceptance (although we find this word problematic). 91% of non-LGBTIQ people supported LGBTIQ inclusion initiatives; 84.8% were comfortable being around LGBTIQ people talking about their families and partners; 78% believed that jokes and innuendo targeting LGBTIQ people were not acceptable and 80% stated that they would call this behaviour if they witnessed it within their team.
Allies by Gender or Age?
We often get asked if women are more likely to be allies than men, or if age is a factor. The survey found that 65% of non-LGBTIQ women considered themselves an ally as opposed to only 47% of men; however age did not seem to have an impact.
Allies make a difference
It was clear that visible and active allies do make a difference to the overall sense of inclusion within a workplace. While some LGBTIQ people are perfectly comfortable within their own skin and don't rely on allies for their overall sense of inclusion and acceptance; 57% of those with a diverse sexual orientation, 44% of trans/gender diverse people and 63% of intersex people stated that allies DID make a difference to their personal sense of inclusion within the workplace.
The activities that LGBTIQ most valued from allies were calling out inappropriate jokes and/or comments; addressing/reporting bullying/harassment; making a concerted effort to utilise inclusive language and seeking to understand the experiences and challenges of LGBTIQ people. Being more visible as an ally and participating in LGBTIQ inclusion initiatives also rated very highly.
Why aren't people allies?
22% of non-LGBTI respondents stated that they were unsure as to whether they would consider themselves an ally 19% stated that they would not. When investigating the reasons behind these responses; interestingly only 10% cited religious or cultural beliefs (down from 12.6% last year). The top two reasons for not being an ally were (1) not knowing WHY somebody should be an LGBTIQ ally (34%) and (2) not knowing where to get started (19%). This clearly points to a need for greater awareness, storytelling, education and resources to support workplace allies.
written by Dawn Emsen-Hough, Director, ACON's Pride Inclusion Programs | 28 August 2019
This edition of AWEI PRACTICE POINTSfocuses on being out, open and authentic at work and the impacts to LGBTI engagement as a result. This year the survey collected responses from 27,347 respondents; 19% (n5,257) identified as LGBTI. 63% of those with a diverse sexual orientation were completely out/open at work (as opposed to approximately 50% last year); 28% of trans & gender diverse people and 29% of intersex people.
“BEING out” - AGE IS STILL A FACTOR!
Last year we reported that 18-24 year olds were least likely to be out at work with only 28% of people within this age demographic indicating that they were out completely.
This year we saw a significant improvement within this demographic with 44% of 18-24 year olds now stating that they are completely out at work; a 57% increase on last year’s numbers. However, age is still a determining factor when it comes to being out.
While the incremental link between age and being out at work was clear for sexual orientation, it is important to note that being OUT is different to being open about being Intersex, or having a trans experience. Not only is the linkage NOT there for these groups, but the need for authenticity does not rely on disclosure.
NO. 1 REASON FOR NOT BEING OUT
The number one reason for not wanting to be out for those of diverse sexuality was not wanting to be labelled (42%), closely following by 41.8% of respondents claiming that they were just not comfortable enough to be out at work.
OUT AND OPEN AT WORK ACROSS ALL LGBTI POPULATIONS
Of the 5016 respondents with a diverse sexuality, 63% stated that they were completely out at work, 26% were only out to selected people and 11% stated that they were not out at all.
In terms of trans and gender diverse respondents (n355); 29% stated that they were open about their gender identity at work, 62% stated that they were not (remaining did not respond). However, we need to be mindful that for many of those who have affirmed their gender, there would be no benefit or perceived need to disclose their trans history. Living their affirmed gender is being authentic.
Of the 29 intersex people who responded, 41% stated that they were open about being intersex at work.
ENGAGEMENT DATA
This year we asked a series of questions that are popular in assessing employee engagement and asked those who are intersex, of diverse sexuality and/or gender to self-assess what they believe were the top four positive and negative impacts of being out/open at work.
Diverse Sexuality
Top 4 positive impacts: being out at work
By comparison, the top 4 -ve impacts of being out were: Less inclined to Network 2.5%; Less inclined to talk positively about the organisation 1.8%Less Engaged 1.7%; More Inclined to Leave 1.6%;
Being completely out has a significant impact on engagement (diverse sexuality)
The impact of being completely out at work for those of diverse sexuality, as opposed to only being partially out at work had a significant impact of engagement (see chart below).
Trans & Gender Diverse Employees
Top 4 positive impacts: being open re: Gender Identity or Trans History at work
By comparison, the top 4 -ve impacts of being out were: Less inclined to Network 6.2%; Less inclined to engage in organisational activities 5.7%Less inclined to talk positively about the organisation 5.3%; More inclined to leave 4.9%
Intersex Employees
While there were far few responses to these questions from Intersex people (n29), we have included these; while these lower numbers cannot be indicative of the our Intersex population, they do give a voice to those who responded.
Joining Decisions
Having a positive track record in LGBTI inclusion is still a positive influencer on a candidate’s decision to join an organisation.
What do our mature age (55+) employees really think about LGBTI* Inclusion Initiatives
written by Dawn Emsen-Hough, Director, ACON's Pride Inclusion Programs | 7 August 2018
Some of us (of a particular age group) cringe at the term ‘mature age workers’. There is also a perception that those more mature within our organisations may be a little more conservative in their views when it comes to LGBTI inclusion – but is that really the case?
With 3,098 mature age workers responding to the 2018 Australian Workplace Equality Index (AWEI) survey, we thought we would find out. 2,797 respondents fell within the 55-64 year age range and 281 were 65+ years or older. All working within organisations active in LGBTI workplace inclusion (to varying degrees).
Of all respondents, 75.83% were located within city/metropolitan areas; 18.55% within Regional; 4.35% Rural and .75% Remote. 47 people were currently working internationally. All states and territories were covered.
Of the sectors/industries represented 34.5% came from the private sector; 41% from Government; 18.3% from Higher Education; 2% from NFP/Charities and 4.2% from Health & Wellbeing.
To read the summarised report of findings, please click here.
The AWEI survey is the optional employee survey conducted as part of the Australian Workplace Equality Index (AWEI), Australia's national benchmark for LGBTI workplace inclusion. The survey is conducted annually to investigate the impact of LGBTI inclusion initiatives on the workforce and workplace culture. In particular, it captures the impact of inclusion initiatives on LGBTI employees themselves, that which is making a difference to them, and challenges that are still faced. It provides employees of participating organisations a chance to have their say and also make suggestions on areas that will signficantly impact their day to day work experience. In 2018 the survey received 23,120 responses. These fact sheets will deep dive into the data on a regular basis providing Australian Diversity Professionals, HR, Executive Sponsors and Network leaders with local current data to support their initiatives.
written by Dawn Emsen-Hough, Director, ACON's Pride Inclusion Programs | 7 June 2018
The AWEI (Australian Workplace Equality Index) has been benchmarking LGBTI workplace inclusion across Australian workplaces annually for the last eight years. Part of the index is an optional employee survey that dives deep into the workplace experiences of not only LGBTI employees within organisations active in, or just starting work in LGBTI inclusion, but also the impact of inclusion initiatives on the overall employee population, their views and perceptions.
This year, 23,120 responses were received.
After many years of looking at statistics in terms of the number of people that are happy to be out at work, their key drivers and also the reasons behind those who choose to hide their sexuality, gender identity or intersex status, we were surprised to see this year, a much more balanced commonality of responses. The disparity in experiences or views was not as apparent as in years past, yet the numbers of people comfortably out in the workplace (completely) and the reasons given for not being out saw very little change.
While the collective data taken from all respondents gave us some great information, the real findings became apparent when we started to filter that data by identity (lesbian, gay, bisexual, trans, gender diverse and intersex employees), respondent age group and role or seniority within an organisation. We also filtered by Aboriginal and/or Torres Strait Islander respondents but found this set of data highly consistent with overall findings. In addition, we looked at samples of respondent data from both our highest and lowest scoring AWEI employers.
Key Findings across all demographics
Of the 3,912 LGBTI respondents, only 49.85% were completely out at work; 14.26% not at all; the remaining to various degrees.
Gay men (n=1875) saw the highest percentage (87.78%) of those completely or moderately out at work; followed closely by gay/lesbian women (n=781) at 87.58%.
Of the reasons for not wanting to be out, the two highest ranked were not wanting to be labelled (42.5%) and just not comfortable enough to come out at work (41.05%). This was clear across all demographics.
Key reasons for coming out at work were being authentic at work (69.53%) and having the freedom to talk about life / partner / family (59.13%).
Of those who were out at work, 49.51% agreed that they were extremely comfortable being out, with 9.14% claiming that being out had a very positive (9.14%) or positive (14.42%) impact on opportunities offered or career progression.
Despite the majority (61.82%) feeling that being out did not have an impact on their productivity, 11% claimed that they were significantly more productive and 25.86% more productive.
Unlike that which we are used to claiming, the majority of LGBTI people did not feel that they expended energy hiding this part of themselves at work (37.43% strongly disagreed; 28.06% disagreed) which would imply that people are generally much more comfortable bringing their whole selves to work.
The majority of LGBTI people, with the exception of asexual employees felt that it was either very important (52.61%) or somewhat important (27.4%) for them to be out at work.
Of those who were out, 80.5% were out to their manager, with 46.42% claiming that this had not changed their relationship with their manager, and 31.22% claiming that it had changed for the better.
Top two reasons for not being out to their manager were mostly consistent across all demographics and aligned to key reasons for not wanting to come out altogether: these were not wanting to be labelled (27.24%) and fear that it would make them (their manager) uncomfortable (19.66%).
While these findings were highly common across all groups, the real differences, as mentioned, came when we filtered those who were non-heterosexual by:
Identity - Gay men (n=1875) / Lesbian/Gay Women (n=781) / Bisexual men (n=258) / Bisexual women (n=781) / Asexuals (n=88) / Trans & Gender Diverse employees (n=344) / Intersex employees (n=54)
Age -18-24 years (n=362); 25-34 years (n=1374); 35-44 years (n=1109); 45-54 years (n=758) and 55+ years (n=296).
Role or Seniority - CEO/Exec Leaders (n=20); Middle Management (n=595); Team Leaders/Supervisors (n=1442); Grads/Interns (n=128); Professional (Consultants / Contractors / Professional roles) n=328 and Academic (n=169).
AWEI Ranking - a similar size, random sample of responses from those working at higher ranking and lower ranking organisations across a range of industries.
Aboriginal and/or Torres Strait Islanders (n=121)
While the data is rich and there are many more filters that we could have applied, this initial snapshot uncovered some interesting differences between the groups. While the majority of this initial view focused on coming out in terms of sexual orientation, we did also ask about employees comfort level being open (or out) about their trans history and/or gender diversity and also comfort levels in disclosing one's intersex status.
To view a five page summary of these finding, please click here.
To join the mailing list to received regular updated on LGBTI workplace data, please click here.
(c) Pride in Diversity, ACON
Should you wish to quote any of these findings, please reference: AWEI(2018), Pride in Diversity - ACON, www.pid-awei.com.au
The Australian Workplace Equality Index (AWEI) Survey is an optional component of the LGBTI benchmarking instrument used to assess, benchmark and shift practice in LGBTI Inclusion within Australia. Academic insights and an executive summary of the survey results will be released mid-2018 by ACON’s Pride in Diversity Program. In 2018 the survey received 23,120 responses. These fact sheets will deep dive into the data on a regular basis providing Australian Diversity Professionals, HR, Executive Sponsors and Network leaders with local current data to support their initiatives.
IDAHOBIT Message: Post Marriage Equality, do we still need to focus on LGBTI inclusion?
written by Dawn Emsen-Hough, Director, ACON's Pride Inclusion Programs | 17 May 2018
Today (May 17) is IDAHOBIT, International Day against Homophobia, Transphobia and Biphobia. The day aims to coordinate international events that raise awareness of LGBTI rights violations and stimulate interest in LGBTI rights work worldwide.
On days like this, those of us who are a little older may look back and reflect on how far we’ve come. For those that have grown up in a more inclusive society surrounded by inclusive family and friends, they may well question what all the fuss is about.
In the 2018 AWEI employee survey comprising 23,120 responses, 9.9% of respondents believe that now we have marriage equality, we no longer need to spend any time on LGBTI workplace inclusion. Yes, there have been some great wins but while we still celebrate the passing of the Same Sex Marriage Bill in Parliament on December 7, 2017 and still feel the emotion of Australia’s majority voting yes, our work is far from complete.
You can’t deny the enormity of work that has been undertaken by many Australian employers in terms of LGBTI workplace inclusion. The Australian LGBTI Inclusion Awards to be held on Friday in Sydney are a testament to this. Further, evidence of shifting practice is backed by the AWEI and it would still be hard to identify any other area of D&I practice that continues to grow at the rate and pace of this area of work.
So do we really still need to put energy and focus into LGBTI inclusion? Overwhelmingly, the answer has to be yes.
All areas of diversity and inclusion practice are essential to the creation of effective, productive, innovative and engaged workforces. But please let us not assume that because we have marriage equality, we can relax all that we do in LGBTI workplace inclusion. Our work is far from over.
The 2018 AWEI Employee Survey reports the following (and please keep in mind, participating organisations are those that already have LGBTI inclusion initiatives underway):
OUR LGBTI INCLUSIVE CULTURES (?)
25% of respondents have personally witnessed or been made aware of negative commentary or jokes targeting LGBTI people within the last year, 36.5% of those people did nothing about it.
6% witnessed more serious bullying/harassment of LGBTI people, 30% of those people did nothing about it.
13% of people did not feel confident that their managers/team leaders would address bullying/harassment (overall population)
14% did not feel that LGBTI employees could comfortably be themselves at work without fear of constant innuendo, jokes or negative commentary
26% would not consider themselves an ally of LGBTI people
11% of respondents would not support LGBTI colleagues talking about their life at work, having photos on their desk or bringing family members to work events
If we look at a breakdown of different LGBTI identities and their experiences:
Personally experienced unwanted negative commentary or jokes at your current place of employment within the last year?
Same sex attracted / Same and other sex attracted employees (n=3965) - 32.42%
Trans/Gender Diverse employees (n=351) - 41.27%
Intersex People (n=65) - 38.89%
Personally been the target of more serious bullying/harassment at your current place of employment within the last year?
Same sex attracted / Same and other sex attracted employees (n=3965) - 6.35%
Trans/Gender Diverse employees (n=351) - 10.68%
Intersex People (n=65) - 7.02%
Those who have experienced either of the above and considered leaving current place of employment within the last year due to the this:
Same sex attracted / Same and other sex attracted employees - 68.54%
Trans/Gender Diverse employees - 55.5%
Intersex People - 11.54%
Of those who had personally been the target of more serious bullying/harassment within the last year, where has this come from?
Bullies: Immediate Team
28.91% reported by Same sex attracted/ Same and other sex attracted
27.78% reported by Trans/Gender Diverse employees
75% reported by Intersex employees
Bullies: Immediate Manager
24.64% reported by Same sex attracted/ Same and other sex attracted
36.11%reported by Trans/Gender Diverse employees
25% reported by Intersex employees
Bullies: Senior Leader
26.07% reported by Same sex attracted/ Same and other sex attracted
27.78% reported by Trans/Gender Diverse employees
50% reported by Intersex employees
Bullies: Colleagues (not immediate team)
40.76% reported by Same sex attracted/ Same and other sex attracted
38.89% reported by Trans/Gender Diverse employees
25% reported by Intersex employees.
Bullies: Suppliers / External Parties
7.48% reported by Same sex attracted/ Same and other sex attracted
11.11% reported by Trans/Gender Diverse employees
25% reported by Intersex employees.
While we of course agree that all areas of diversity and inclusion practice are essential to the creation of effective, productive, innovative and engaged workforces, let us not assume that because we now have marriage equality, our work is complete. It is far from complete. We still have so much to do.
The Australian Workplace Equality Index (AWEI) is Australia’s national benchmarking instrument for LGBTI workplace inclusion in Australia. Accompanying the AWEI is an optional employee survey. The 2018 AWEI collected 23,120 responses from employees of all identities; of which 4,149 openly identified as LGBTI.
The Australian LGBTI Inclusion Awards held May 25, 2018 in Sydney celebrate the results of the Australian Workplace Equality Index 2018. For more information on the AWEI go to: www.pid-awei.com.au.
April 26: Do we really need a Lesbian Visibility Day?
written by Dawn Emsen-Hough, Director, ACON's Pride Inclusion Programs | 23 April 2018
"Over the past few years I’ve been asked many times to name positive, out lesbian role models. Often I’ve joked in response: Ellen DeGeneres and…Ellen DeGeneres!
In Australia we can now proudly add our national sweetheart Magda to the list, but the reality is, in our patriarchal world, the gay men have made it to public acceptance and prominence way ahead of us girls. And it’s been the same in business. Compare the relative profiles of Qantas CEO Alan Joyce and Business Council of Australia chief executive Jennifer Westacott. Sadly, it was no surprise in late 2016 when The Australian Financial Review’s BOSS magazine and accountancy firm Deloitte put together a list of top 50 LGBTI business leaders, and only 14 of them were women.
The glass ceiling exists and it appears to be an even more insurmountable barrier for women who identify as lesbian. And yet these are the women who most need to know they are not alone in their workplaces. They are telling us loud and clear that knowing there are other lesbian women in their organisations gives them the greatest sense of inclusion and engagement. It’s a simple thing, but promoting visibility helps breaks down stereotypes, builds respect and provides genuine support. That’s good for your people, and what’s good for your people is good for business."
Christine Forster, Pride in Diversity Sapphire Ambassador
April 26 is Lesbian Visibility Day. With workplaces active in LGBTI inclusion already promoting several LGBTI days of significance throughout the year, many may be tempted to give the lesser known dates that focus on one particular identity a miss … but should we?
Undoubtedly many workplaces will question the need to communicate Lesbian Visibility Day out to their employees and perhaps even question the need for it. But before you dismiss the idea altogether, it may be useful to understand the message of this day within the context of the workplace.
Lesbian Visibility Day is an opportunity to knock down some of the stereotypes, help reduce some of the stigma and give a voice to our Lesbian workmates and colleagues. Something that is critical, as you will see, to an inclusive culture.
Why is this important?
According to the latest AWEI Survey (2018) [1] a significant number of lesbian women within organisations active in LGBTI inclusion still choose to consciously hide their sexuality and a core part of who they are because at this point in time, they are just not comfortable enough to be themselves at work (40%), they don’t want to be labelled or the target of innuendo and jokes (28%) or they are just unsure of the repercussions (21.43%).
The impact of this is a significant lack of out lesbian role models.
The survey found that of all the sexualities, it was lesbian women that most strongly aligned OUT role models to their sense of inclusion within the organisation (90%); 87.7% of the respondents also stating that an LGBTI inclusive culture was important to their level of engagement.
Backtrack on that for a moment.
· There are very few out lesbian role models
· OUT role models are aligned to a sense of inclusion
· An inclusive culture is important to engagement
It’s not difficult to see the benefit of what we are talking about here.
Surprisingly, according to these respondents, the most sought after attributes of out role models were not along the lines of technical expertise or an outstanding career trajectory, rather their willingness to be open about their sexuality (67%) and willingness to support others (76%).
So if there are not many out role models for lesbian women and this is what makes them feel that their organisation is inclusive, what is the key driver for those women who choose to come out at work, regardless?
In this respect, there’s not a lot of difference between lesbian women and other sexualities. The key drivers it appears for all sexualities are personal authenticity at work (lesbians: 66.1%; bisexual women 55.4%; gay men 76.4%; bisexual men 59.6%); the freedom to talk about their life/partner/community (lesbians 64.1%; gay men 60.9%) and expending less energy censoring what they say (bisexual women 54.6%; bisexual men 52.1%).
While 21.8% of lesbian women claimed that being out had had a positive impact on their career (22% lower than gay men) and 53.9% said they were extremely comfortable being out at work (2% less than gay men) there are still challenges.
Of all sexualities, lesbians reported the highest rates of unwanted negative commentary, innuendo and jokes (34; 4% higher than gay men and 19% higher on average than bisexual men and women) in addition to the highest rates of more serious bullying/harassment (7%; 15% higher than gay men and 33% more on average than bisexual men and women).
Lesbian women who were the target of bullying/harassment within the workplace identified other people on their floor (41.5%), colleagues (39.6%) and their immediate manager (32.08%) as the top three culprits. 20.75% of lesbian women who were bullied/harassed were currently looking for other roles as a direct result of this bullying.
While It is clear that we still have a long way to go in terms LGBTI workplace inclusion, it appears that when it comes to sexuality, the road is even longer for those who identify as lesbian.
We need to break down the barriers. We need more training and zero tolerance in terms of homophobic (and transphobic) behaviours and we need to create an environment where more lesbian women feel safe enough to come out at work, to be a role model, to help support other young women entering the workforce through their openness in terms of their sexuality and their willingness to support.
Let the voices of your Lesbian women be heard this Lesbian Visibility Day. It could make a world of difference.
[1]The Australian Workplace Equality Index (AWEI) Survey is an optional component of the LGBTI benchmarking instrument used to assess, benchmark and shift practice in LGBTI Inclusion within Australia. This year the survey returned 23,120 responses comprising 1,539 same sex-attracted women; 781 identifying exclusively as lesbian. Survey results will be released mid-2018 by ACON’s Pride in Diversity Program.
About Pride in Diversity’s Sapphire Initiative
Sapphire is an initiative of Pride in Diversity that was developed to generate greater awareness of the unique challenges faced by lesbian, bisexual, transgender and intersex (LBTIQ) women in the workplace. While Sapphire provides members who choose to participate with an opportunity to network, role model and mentor; the core focus of the program is to engage with LBTIQ women across all sectors to fully understand the organisational factors that impact disclosure and inclusivity within organisations active in LGBTI workplace inclusion. This will not only allow Pride in Diversity to contribute to the growing body of research on the invisibility of LBTI women but will also allow us to utilise the collective understanding to promote a more inclusive workplace culture.
If your employer is a member of Pride in Diversity and you would like to sign up to the Sapphire newsletter: click here
Dawn Hough is Director of ACON’s Pride Inclusion Programs, employer support for all aspects of LGBTI inclusion across the workplace (Pride in Diversity), sport (Pride in Sport) and Health & Wellbeing Service Provision (Pride in Health + Wellbeing). For more information on ACON’s Pride Inclusion Programs please visit www.prideinclusionprograms.com.au
Why Benchmarking is so critical in Diversity and Inclusion
written by Dawn Emsen-Hough, Director, ACON's Pride Inclusion Programs | 9 February 2017
While I think most Diversity & Inclusion (D&I) professionals would say that we have made some progress and that the business case for diversity is now widely acknowledged and communicated (even it is does sometimes appear a little well-rehearsed and a somewhat tired piece of diversity rhetoric), this D&I game is still a tough gig. Many would argue that support is still just lip service, that while we just roll the benefits off our tongue and get the executive nod when its needed (because it’s something we should all be paying attention to), when it comes to the crunch ie. the tough stuff (additional resources, budget or Senior Leadership KPIs) there is still some considerable pushback.
Many of us would passionately argue that we are still falling behind, not making enough progress in terms of seeing more women on boards or in C-suite positions, Indigenous employment, cultural diversity or in the areas of accessibility & disability; and yet we see some extraordinary growth and some amazing work by passionate “on the ground individuals” in areas such as LGBTI inclusion. I’m not saying that LGBTI inclusion is there yet, by no means, but the impact of passionate individuals desperately wanting to help drive the change in their own organisations in support of their diversity and that of loved ones, is becoming a force for change that is drawing the attention and getting the buy-in of many a one-time diversity-worn sceptical leader.
For as many papers being written on the positive impact or otherwise of D&I initiatives, there as many arguments for and against what are deemed to be the best approaches. Is it all about targets and accountabilities or about focus groups, listening circles and tailored solutions? Do we roll all D&I initiatives into one bucket leading to a collective set of outcomes or do we created pillars of focus running the risk of perceptions that we are giving more attention to one set of diverse individuals over another? Do we follow the latest trend or deep-dive into our own culture, understand it first and then devise the strategy? And if we take the latter approach, do we risk being so inwardly focused that we lose track of the progress that other organisations are making outside of our inner circle? Welcome to the life of a diversity practitioner.
I personally have no doubt that there are answers in many of these seemingly opposing views, but I still keep coming back to the need for local benchmarking, as tedious as the process can sometimes be. If we have a regularly updated national benchmark on what currently constitutes good practice, then we have a road map, a current roadmap, a local roadmap to guide us. Not one derived from what other countries are doing based on their different histories, different workplace cultures, different laws and different experiences of diversity but on what we are doing here in Australia. If the benchmark has a way of identifying the areas of current and leading practice, provides quantitative and qualitative feedback on the work that we doing in the assessed area and a means by which we can track progress year on year, then we can not only drive our internal initiatives in a culturally appropriate way, but we can, move with the benchmark as it moves ensuring that we are always on top of the game, not independent of it.
Important in any benchmark is the ability to measure not only what the organisation does in order to meet the current standard, but the impact that it is having on the lived experiences of those on the ground; whether they belong to a diverse community or not. We need to balance the work of the organisation with the impact on the culture, on the people and on the very lives of those we are trying to improve through the provision of equitable and respectful workplaces. Combined with comprehensive metrics we can then track the impact that these initiatives have on retention, engagement, promotions, team compilation and leadership representation. Benchmarking also gives us that all powerful insight into what our peers are doing, how we compare to our competititors, our suppliers, those in the same industry or sector.
Benchmarking does take time admittedly, but the value you get during the lifespan of your work within the different aspects of D&I is invaluable. It’s well worth the commitment.
Dawn Hough is the Director of ACON's Pride Inclusion Programs specialising in LGBTI inclusion within Australian workplaces (Pride in Diversity), sporting contexts (Pride in Sport).
Pride in Diversity are also the publishers of the Australian Workplace Equality Index (AWEI) - a national benchmarking tool for LGBTI workplace Inclusion. The AWEI is a free service offered to all Australian Employers regardless of where they are on the LGBTI Inclusion journey. For more information on the AWEI (submissions close in mid March every year), visit: www.pid-awei.com.au