Category : AWEI

Home»Archive by Category" AWEI"

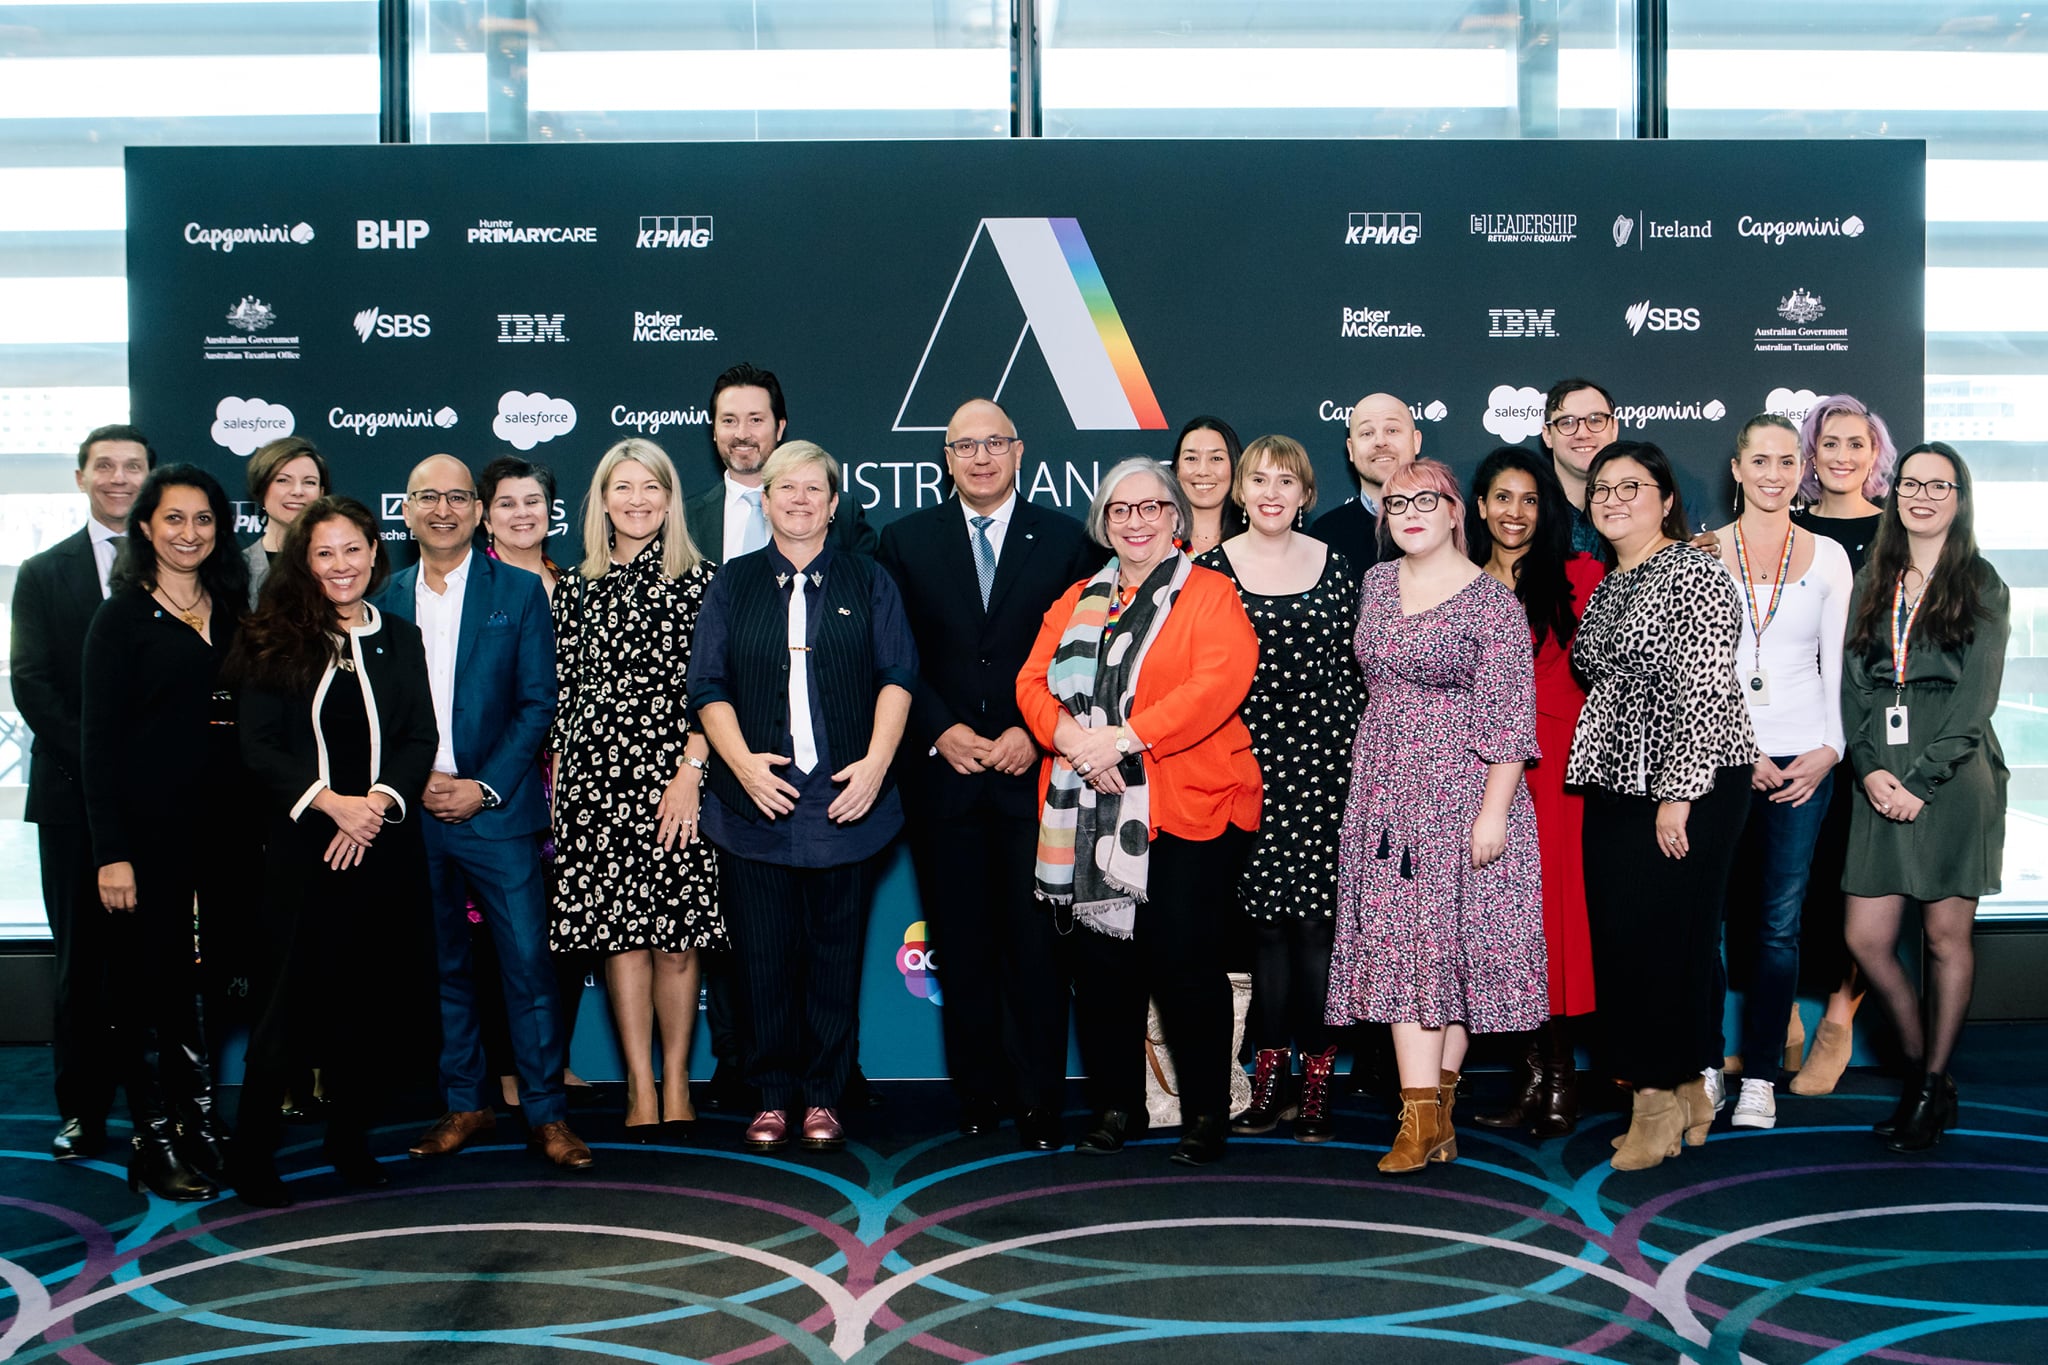
TOP AUSTRALIAN ORGANISATIONS FOR LGBTQ INCLUSION IN 2021 ANNOUNCED


The ABC, information technology services and consulting company Capgemini, and community support agency Advance Diversity Services are among this year’s top employers and service providers announced at this year’s Australian LGBTQ Inclusion Awards held in Sydney.

Capgemini was named ‘Employer of the Year’ for the first time, while management consulting company Oliver Wyman was announced ‘Small Employer of the Year’. Network of Alcohol and other Drugs Agencies (NADA), which is NSW’s peak organisation for non-government alcohol and other drugs services, was named ‘Service Provider of the Year’.

Other top honours went organisations including Dentons, Deutsche Bank, IBM, Woolworths, Coles, the University of NSW and Deloitte, who all received high tiered ranking for LGBTQ inclusion. The ABC was named ‘Most Improved’ and also took out the ‘External Media Campaign’ award. (NB: Full list of award recipients and finalists below.)

Held at the Hyatt Regency, the sold-out event is Australia’s foremost annual celebration of LGBTQ workplace inclusion. It is hosted by ACON’s Pride Inclusion Programs, the national not-for-profit LGBTQ inclusion support program for employers, sporting organisations and service providers.

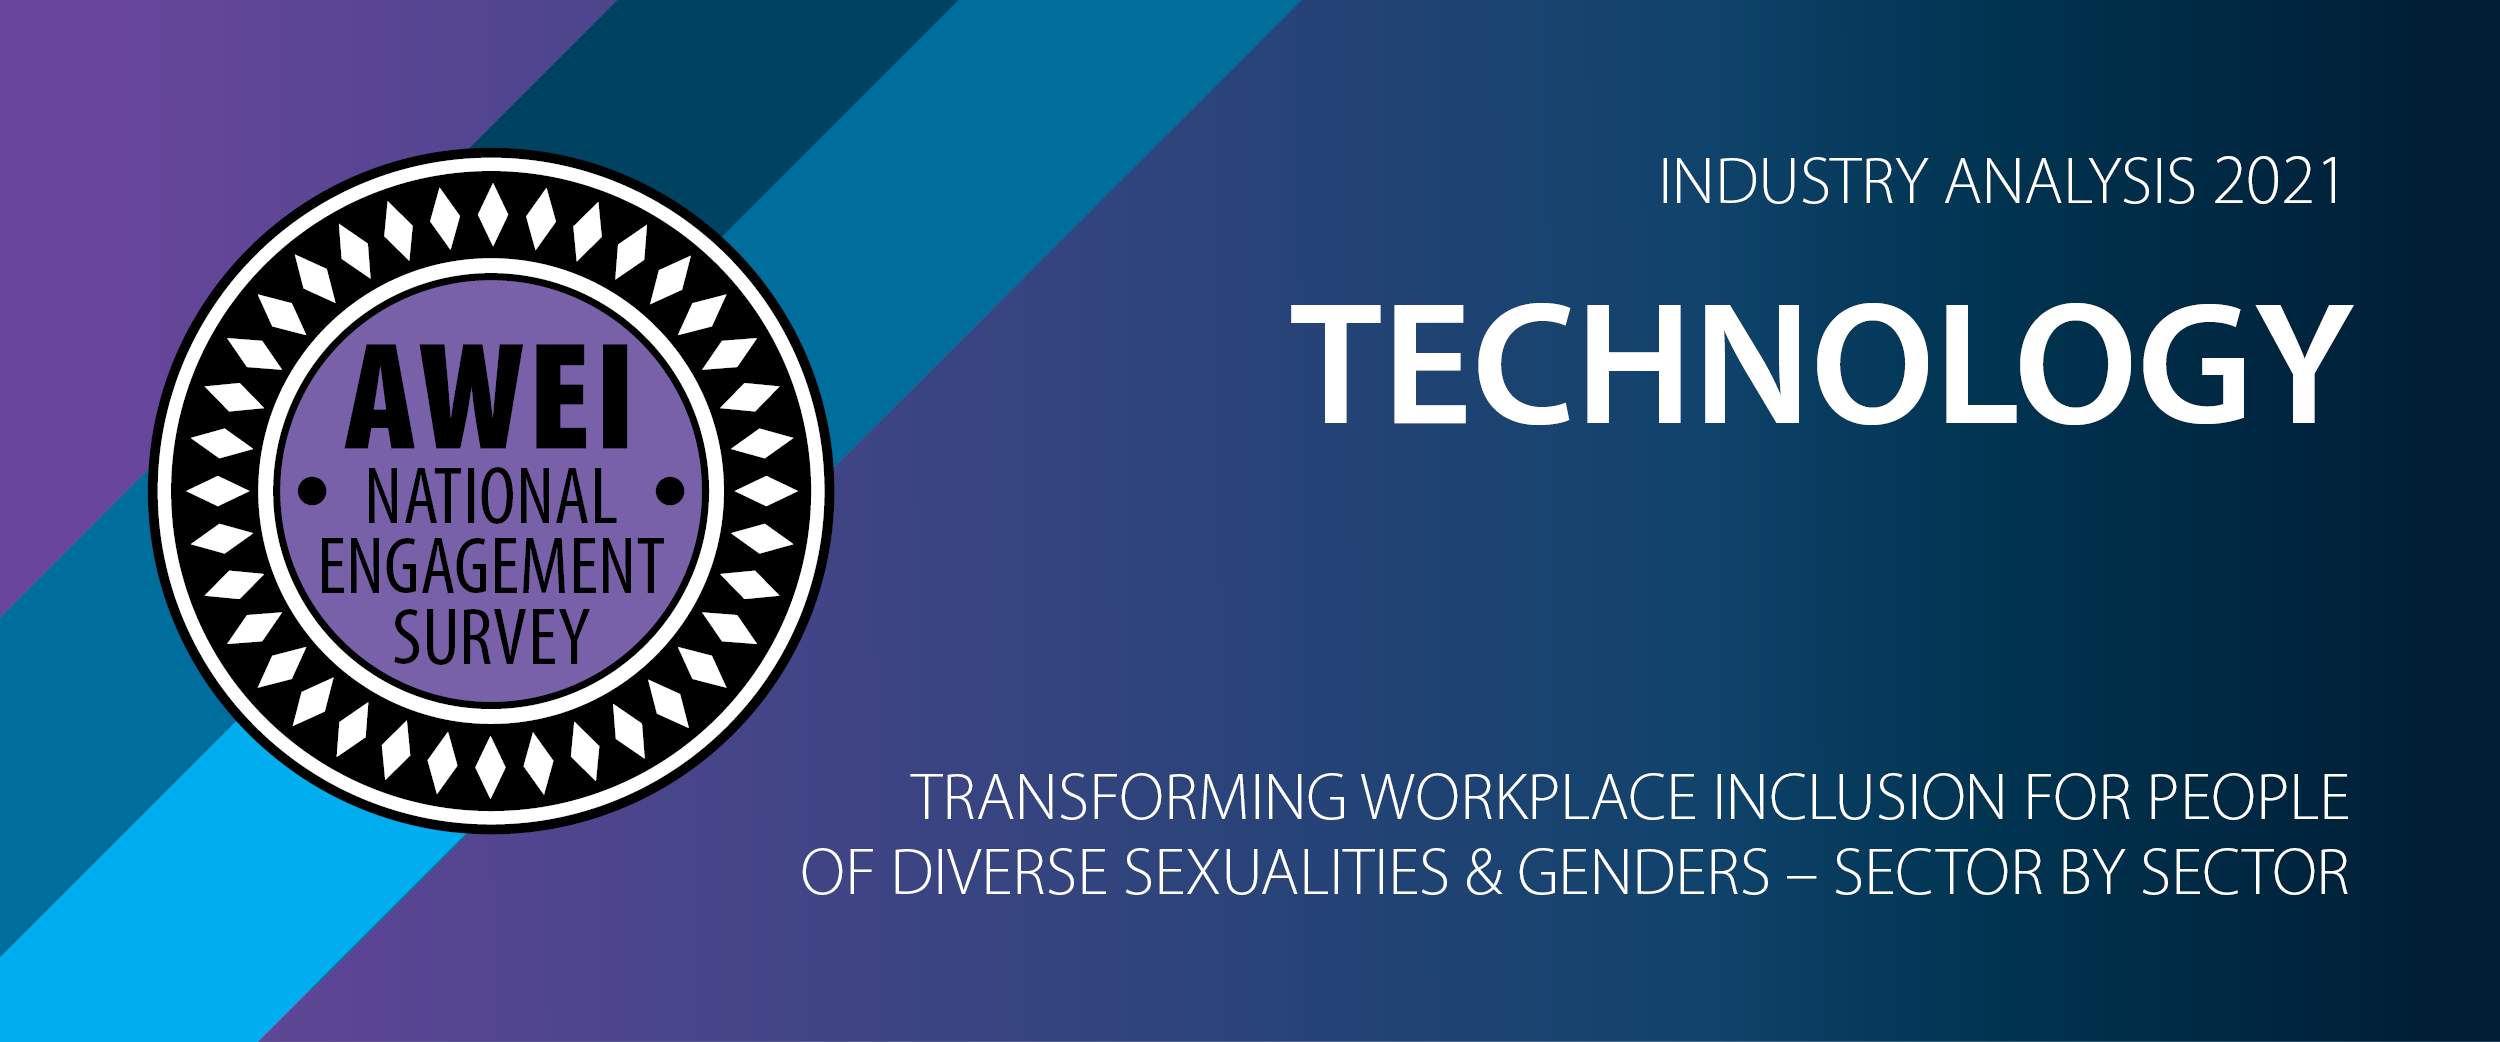
The awards are based on the results of the Australian Workplace Equality Index (AWEI) – which is now in its eleventh year – and the third Health + Wellbeing Equality Index (HWEI). The AWEI and HWEI are rigorous and evidence-based benchmarking tools that annually assesses workplaces in the progress and impact of LGBTQ inclusion initiatives.

By participating in the AWEI and accompanying employee survey, employers are able to benchmark their practice against other organisations and obtain annual data on the impact initiatives are having on their employees.

Dawn Emsen-Hough, Director of ACON’s Pride Inclusion Programs, said she was proud to see the indices continue to achieve record growth and participation following a year that saw a lot of difficulty and uncertainty.

“Over the past year, we have seen incredible advancements in workplace diversity and inclusion despite turmoil we all experienced on a global scale. It’s incredibly encouraging to see workplaces in Australia continue to remain dedicated and stride towards greater inclusion of our LGBTQ communities,” Emsen-Hough said.

“As we continue to progress, it’s vital that efforts are acknowledged and celebrated, and that we continue to maintain and build upon our achievements.”

The AWEI saw a record 186 organisations across Australia participate this year, and an employee survey attached to the index received 44,915 responses, the highest it has ever received. In its inaugural survey, the HWEI saw over 700 responses from 24 organisations/service providers.

Emsen-Hough added: “Once again, we have record numbers of employers across all sectors participating in the indices. The employee survey that accompanied the AWEI, and for the first time, the HWEI, provides us with a great insight into workplace attitudes towards diversity and inclusion.

“Congratulations to all the award recipients announced today, including those the receiving Bronze, Silver, Gold and Platinum Employer status, as well as those that received organisational awards. I commend all of them on their significant achievements and for showing great leadership in LGBTQ inclusion.”

“These awards truly give us an insight into the amazing breadth of work being done by so many in making organisations across Australia more inclusive of LGBTQ people and communities.”

Click here to download a PDF version of this media release.

For more information on ACON’s Pride Inclusion Programs, go to www.prideinclusionprograms.com.au

Winners from the Australian Workplace Equality Index

Winners from the Health + Wellbeing Equality Index

Individual Awards Categories – Finalists and Winners

The Australian Workplace Equality Index National Engagement Survey 2021: Technology Sector Observations

written by Mark Latchford, Associate Director, Pride in Diversity |15 June 2021

The 2021 engagement survey saw a significant increase in participants from the Technology sector, with over 2,800 survey respondents from organisations with the sector. (The analysis does not include those technology professionals employed in other sectors). Of these, 326 participants identified as being part of the LGBTQ community.

In regard to the demographic segmentation, the sector differs from the national mix in a number of significant areas:

  • The sector is more centralized into NSW (54% compared to 30% of the national cohort)
  • Has more employees with bachelor degrees (44% vs 32%)
  • Has more men than women (55% vs 43% whereas the national mix is 43% 54%)
  • The sector also appears to be under-represented by Aboriginal and/or Torres Strait Islanders, people living with disabilities and mature age employees. It has a higher representation of people of colour and those who have a CALD background.

When you look at the state of LGBTQ workplace inclusion, the survey indicators that the technology sector is performing better than most. In nearly all the key questions within the survey, the sector records better performance than the national results.

Some of the most pronounced differences include:

  • 70% of respondents in the sector thought an organisation positive track record in this aspect of inclusion would positively influence me to join the organisation. (59% nationally)
  • 86% thought that Initiatives in this sea have been regularly communicated during the year (n: 75%)
  • 74% stated that awareness or ally training was made available throughout the year (n:59%) and 54% had attended such training (n:35%)
  • 69% claimed jokes and innuendo were called out  and addressed (n:57%)
  • 10% witnessed of negative behaviours/mild harassment which was 14% nationally.

Business case indicators were also more positive with 90% of the professionals feeling productive at work (n:88%) and 86% feel engaged (n:81%). Health and wellbeing indicators are also higher than average.

In regard to Allies, the sector matches the national profile, except when asked why not an active ally, being too busy is cited 50% of the time (versus 42% by the national cohort)

Communication about inclusion as it relates to sexuality and gender diverse employees is markedly better in the technology sector, across all areas but especially in the recruitment process (72% vs 53%)

Executive endorsement is also significantly better (86% vs 67%) as is network promotion (86% vs 68%), training promotion (75% to 57%). It is particularly pleasing to see 81% felt managers would address negative commentary and jokes (n: 66%) and active allies are visible to 75% of the cohort (n: 57%)

Willingness to recommend the organisation and absence of inappropriate jokes/innuendo is also significant better that national data.  67% felt that active allies had had a positive impact (n:49%)

In regard to the LGBTQ cohort of respondents, 45% being out to everyone was higher than the national 40%, which may reflect the communication vehicles used within the industry.

The sector is also strong in supporting employees coming out to external stakeholders (such as clients). 92% felt support (n: 78%). Sexuality was not having an impact on their career progression 92% vs 81%).

Only 7% had been the target of unwanted jokes and innuendo which is nearly half the  national rate of 13%. Being the target of more serious bullying and sexual harassment was again half the national rate 3% as opposed to 6%.

One of the most significant variation from the national indicators was whether workplace inclusion initiatives (for diversity of sexuality and gender) have had a positive impact on how they felt about their sexuality. 84% agreed on this point, whereas nationally only 60% did.

In regard to not being out, the overall percentage is lower as mentioned. The reasons why tend to be similar but lower than the national data except for “not comfortable within myself to be out at work”. That was cited as the reason by 44% of this sector, but only 37% nationally.

On the question relating to women, the numbers again tended to be significantly better except for one: “Women of similar identity as me are out within senior leadership” , 32% agreed with that versus 39% nationally.

On gender diverse recruiting, the data indicates this sector has progressed well. For example, 49% of respondents found the recruitment process inclusive for diverse gender applicants (n:34%)

Moreover, freedom to use toilets of choice (58% vs n:42%) and availability of all gender toilets (36% vs 28%) was more positive in this sector. Acknowledgement of gender diversity beyond the binary was at 70% (as opposed to 47% nationally. Folk making an effort to use personal pronouns was relatively high (42% vs n: 27%) and being misgendered was below the national average. In nearly all other aspects of gender diversity inclusion, the sector is positively well ahead (double digit differences) from the general national experiences. This includes 2% being the target of serious bullying and harassment for their gender diversity (nationally it is 6%). However, 8% of this sector (and the national cohort) had been the targets of unwanted jokes, innuendo and commentary.

 As previously mentioned, in regard to intersectionality, the sector appears to have achieved results where colour/CALD and neurodiversity intersect with the LGBTQ community, but more work is needed with those of Aboriginal and Torres Strait Islander heritage or those of a mature age.

In summary, the Technology Sector can be proud of their substantive work in this space. Their teams indicate through the survey, that much progress has been made. The data confirms the journey is not done and a number of areas are requiring specific and focused work (confirmed by benchmark results in participating technology firms).

How inclusive are our workplaces of trans and gender diverse employees?

Dawn Hough, Director ACON’s Pride Inclusion Programs

In the 2020 Australian Workplace Equality Index (AWEI) Employee Survey, 33.572 employees working within organisations active in LGBTQ inclusion responded to questions in regard to LGBTQ inclusion initiatives within their organisation. Of those respondents 20.2% (n6787) identified as LGBTQ (Lesbian, Gay, Bisexual, Transgender, Queer). 8.61% of LGBTQ respondents (n582), identified as being gender diverse. Of gender diverse respondents, 296 (just over 68%) identified as having a trans history or experience. 40.38% of trans and gender diverse respondents (n235) identified as non-binary.

The survey this year focused on a number of questions specific to the inclusion of trans and gender diverse employees. It sought to (a) provide insight into the general perceptions of those who worked within organisations active in this space and (b) gain a better understanding of the lived experience of trans and gender diverse employees within these organisations.

This article seeks to summarise some of the key findings, however further insight can be gained via the Practice Points articles published on 3rd June : http://www.pid-awei.com.au/2020practicepoints/

General views – all respondents (n33,572)

We asked a series of questions in regard to (a) how supportive people were in terms of their employers work in LGBTQ inclusion and (b) how active or proactive people were themselves in terms of their inclusion of trans and gender diverse colleagues and team members.

82.1% of respondents overall supported LGBTQ inclusion activity. 91.7% felt that a gender diverse person would be welcome within their team and treated no differently to anyone else. 86.2% of respondents felt that if a member of their team were to affirm their gender, they would be supported within their immediate team and 86.8% of respondents said they would be comfortable referring to a colleague by a new name or personal pronoun should they affirm their gender.

However in terms of believing that there are more than two genders, only 52.6% agreed. Regardless of this, 78.4% said that they would be comfortable using they/their/them personal pronouns for a non-bineary person at work.

On the topic of all gender or gender netural toilets, a topic that tends to divide people more than any other, we do see some decline in support. Disappointingly only 78% of respondents said they would be comfortable with the inclusion of an all gender or gender neutral toilet on their floor even if male/female toilets were still available. Not surprisingly then, the support for all toilets being changed to all gender or gender neutral was low with less than half (46%) of all respondents claiming that they would being comfortable with this.

We were interested to see how the views of LGBTQ people vs non-LGBTQ people differed on this topic. In terms of the inclusion of all gender or gender neutral toilets alongside male/female toilets, LGBTQ people were 13.54% more comfortable than non-LGBTQ people (89.02% vs 75.48%). Comfort levels dropped quite significantly for both groups when it came to all toilets being all gender or gender neutral (65.43% LGBTQ people vs 40.53% non-LGBTQ were comfortable with this).

Lived experience of trans and gender diverse employees

Of all trans & gender diverse respondents, 427 (73.37%) identified as non-heterosexual. When it came to disclosure at work, 38.41% were out to everyone at work in regard to their sexual orientation while only 20.54% strongly agreed that most people they worked with were aware of their gender diversity.

No alt text provided for this image

In terms of the inclusivity of their workplace meeting personal expectations, the responses were mixed with 50% or more respondents agreeing that their expectations had been met or exceeded in only one of the areas of inclusion that we presented (visibility of inclusion for TGD (trans and gender diverse) employees).

No alt text provided for this image

While meeting expectations is a subjective experience, it can of course impact whether or not someone feels that they can be themselves at work which has numerous implications for productivity, engagement and an individuals overall health and wellbeing.

In terms of experience of inclusivity, alarmingly over 25% of respondents did not feel that they could use gendered toilets of choice without opposition and over 15% did not feel that people made an effort to use their personal pronouns. Just over 43% stated that they had been deliberately mis gendered within the last year.

63.7% of trans and gender diverse employees felt mentally well at work. 70.6% felt engaged with the organisation while 46% reported that inclusion initiatives have had a positive impact on how they themselves feel about their gender identity.

Jokes / Bullying & Harassment

13% of respondents reported being personally targeted with unwanted jokes/commentary in regard to their gender diversity, 7% experiencing more serious bullying. The majority (albeit only 60.3%) felt safe and supported reporting continual unwelcome jokes/innuendo to their manager although alarmingly, this number dropped to 58.9% when asked if they would feel safe and supported reporting more serious bullying/harassment.

In closing

In closing, while workplaces are actively doing more to support the inclusion of trans and gender diverse people, and more people are affirming their gender at work there is still considerable work to be done. On the surface it appears that there is significant support for LGBTQ inclusion and the overwhelming majority of non-LGBTQ people are supportive of those affirming their gender at work and feel that trans and gender diverse employees would be welcome and treated no differently within their team. Even when beliefs around gender differ, the majority of people are comfortable using less common personal pronouns (their/they/them) for colleagues.

Despite this, it is still unacceptable that only 47.4% of trans and gender diverse people feel safe and included within their immediate team and only 63.9% feel mentally well at work.

In addition, there is still a significant amount of work to be done around inclusive recruitment practices, in particular for our trans and gender diverse colleagues. An area that Pride in Diversity is committed to exploring further.

For more information data insights on the AWEI annual employee survey, please visit: http://www.pid-awei.com.au/2020practicepoints/

Are our leaders our most active LGBTQ Allies?

Dawn Hough, Director ACON’s Pride Inclusion Programs

This year the AWEI 2020 annual survey of employees working within organisations active in LGBTQ inclusion saw a response rate of 33,572 of which 20.21% (n6,787) identified as being of diverse sexuality and/or gender. This article summarises what this data tells us about our active allies (those who actively support LGBTQ inclusion within their workplaces) and explores reasons as to why others may be more passive in their approach.

Active vs Passive Allies

There is a difference between active and passive allies. A passive ally may support LGBTQ inclusion initiatives, agree that it is important work and acknowledge the positive impact that LGBTQ inclusion initiatives are having on the organisational culture – but do they make a difference to the experience of LGBTQ people in the workplace? The answer is typically ‘no’.

It’s the visibility of active allies that makes the difference

In surveying LGBTQ respondents regarding the visibility of executive allies within their organisation and other allies within their immediate work area, the results were somewhat disappointing given the focus on allies within recent years.  Only 61% of 5,869 LGBTQ respondents knew of executive allies within their organisation and only 66% of 5,866 LGBTQ respondents knew of allies within their immediate work area.

These results made us question the impact that allies were having on LGBTQ people. While initially, it looked as if only 53.1% strongly agreed or agreed that active allies positively impacted their sense of inclusion within the current workplace, that number rose to 65.84% when we filtered only those LGBTQ people for whom active allies were visible. The more visible the active ally to the individual, the greater the sense of inclusion. 

Why aren’t people active allies if they support inclusion.

68% of all non-active allies are happy to support LGBTQ inclusion passively; which indicates that the support is there. 49.5% of people who were not active allies stated that they were just too busy. 45.3% stated that they just didn’t have any interest in the area. We may not be able to do a lot about this. However, the next two commonly cited reasons for not being an ally, we can do something about. 42.8% of people who were not active allies stated that they didn’t know enough about how to be an active ally and 34.6% stated that they didn’t know enough about why they should be one. So our next questions should be:

  • Will ramping up our education or resource materials for allies help shift people from non-active allies to active?
  • Are people thinking that being an active ally requires a significant amount of time? Is this what is holding people back? 
  • Are people aware of why allies are so important?
  •  Are we providing enough information on how time-poor people can be active allies?

We filtered the data by several key questions to determine just how supportive passive allies are. We compared those who neither agreed nor disagreed that they were active allies with those who disagreed or strongly disagreed. This is what we found:

No alt text provided for this image

In summary:

  • Between 67% and 83% of all non-active allies supported the work of LGBTQ inclusion
  • The majority (55%-71%) believed that work in this area had a positive impact on the organisation’s culture
  • And more than half (52.9%-67.1%) believed that training in this area should be mandatory for all people managers.

WOMEN ARE MORE INCLINED TO BE AN ACTIVE ALLY THAN MEN

We wanted to filter the data by various demographics to see if we could pinpoint any patterns in active ally support. For non-LGBTQ respondents, women were 19% more likely to be active allies than men (66% vs 47%) with their top two reasons for not being active stated as ‘don’t know how’ and ‘too busy’. While men also stated ‘too busy’ as being their second most identified reason, their top reason was identified as not having a personal interest in this area.

Interestingly, only 77% of LGBTQ respondents agreed or strongly agreed that they were active allies. Being too busy was their top reason for not being an active ally closely followed by ‘don’t know how’. 5% of LGBTQ respondents responded with ‘not applicable’. This begs the question of whether we need to provide any specific guidance as to how LGBTQ people can be allies for others within their community and how.

ARE OUR LEADERS OUR MOST ACTIVE LGBTQ ALLIES OVERALL?

One of the most interesting findings for us was the clear pattern of declining active allyship once we start to move down traditional reporting lines. The further down the reporting lines, the smaller the number of active allies and the greater the number of those who disagree or strongly disagree that they are active allies.

No alt text provided for this image

We could hypothesise from this data that visible inclusivity is more important, the higher we move up traditional organisational hierarchies. We have long spoken of inclusion being a valued leadership quality and the higher someone moves within traditional hierarchies the more important this behaviour becomes. If this is correct, then what we appear to be missing is the clear message of its importance as we move further down the line. Is the importance of inclusive behaviour (regardless of the diversity dimension we are focusing on) being communicated enough as a valued leadership quality or is it about greater accountability and reward for those people managers who exhibit these behaviours within our organisations.

Clearly there is still much to be done in terms of communicating the importance of inclusive leadership. Our leaders appear to understand and engage in this, we now just need to look at how we can filter that behaviour down the reporting lines.

For more information on AWEI2020 findings, visit: http://www.pid-awei.com.au/2020practicepoints/

© AWEI2020, Pride in Diversity, ACON, www.pid-awei.com.au

Permission is given to cite any of the data within this factsheet providing the reference above is utilise